

Dear INO.com readers,
January turned out to be a harvest month for decent gain opportunities. This week, let's discuss copper which could lose half its weight this year. Impressive! Let's figure out how.
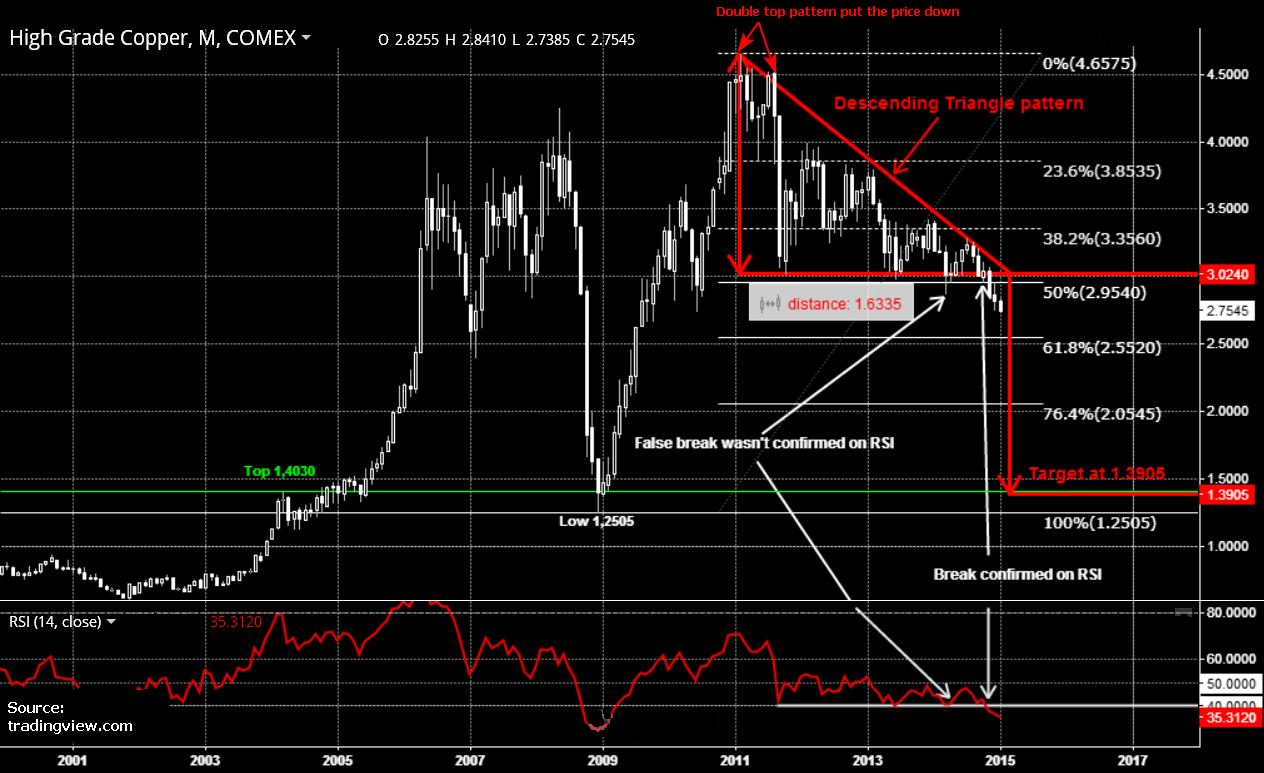
On the chart above, you'll see a monthly candle graph for COMEX high grade copper futures. As you can see, copper isn't phlegmatic at all, see-sawing up and down from below $1, up to almost $5 and again down for the past dozen years. And of course, that's why it is one of the best choices fo speculative traders.
2008 was a disastrous year for copper, free-falling from a $4.26 high to the $1.25 level and losing 70% of its value. Bad news for miners and brilliant for bear traders!
This reddish metal started 2009 as a rocket. Not to overload the graph, I didn't put Elliot waves on the bullish run. Two cycles completed on the way up from $1.25 to $4.55, where the fifth wave stalled with the top done at the $4.65 level at the start of 2011. 2.5 years of total growth thanks to QE. You should have noticed that fall is very short lived compared to unhurried growth, as fear is stronger than greed everywhere in the markets.
In 2011, a double top pattern was shaped and the market crashed down scoring more than $1 just for one month, September was hot! It was a very technical move, the neckline of the double top coincided with a 23.6% Fibonacci retracement level at $3.85. It's clearly seen on the chart that price couldn't break this support on its first try. The second try was successful and triggered the metal’s massive sell-off to the $3 level.
Once the market approached the $3 area, buyers were nimble to buyback copper. Former support, where the neckline of the double top and the 23.6% Fibonacci retracement level crossed, now turned to be tough resistance. The market calmed down into consolidation between the 23.6% and 50% Fibonacci retracement levels highlighted in white on the graph.
Price stuck for three years between 2011 and 2014 in consolidation with three reaction lows horizontally touching the $3 level and seven consecutive lower highs. All of this sculpted a descending triangle formation. This pattern is bearish and requires the horizontal support to be penetrated for a further move down. The first attempt in last September failed, but November brought the break-out, even the 50% Fibonacci retracement level located just below the triangle’s support at $2.95 couldn't stop the fall. A month ago, copper touched that level on a light pullback and now continues its move down.
The target for the triangle’s break-out is located at $1,3905. You can calculate it by subtracting $1.6335 (height of triangle, highlighted in red double arrow) from the horizontal support located at $3.0240 (highlighted in red). It's another $1.364 to fall or almost 50%. If we call the XAU/SEK projected gain of 14% (scored 7% already) or the XAU/EUR potential gain of 18% (scored 1% up to date) to be decent or even impressive, then I can't find the word for a 50% gain in one instrument. Please help me if you know such a word.
Now that the reward is discovered, what is our risk and where are our obstacles? Since the 50% Fibonacci retracement level of $2.95 stopped the recent pullback, then we should square our shorts above that level. To be more conservative, I would put a stop above the $3.03 level, as it will be second resistance. Risk is then 10% and potential gain is 50%, 1:5 – a very conservative risk-reward ratio.
Main supports on the way down are at a 61.8% Fibonacci retracement at $2.55, a 76.4% Fibonacci retracement at $2.05 and a 2004 high at $1.0430, highlighted in green.
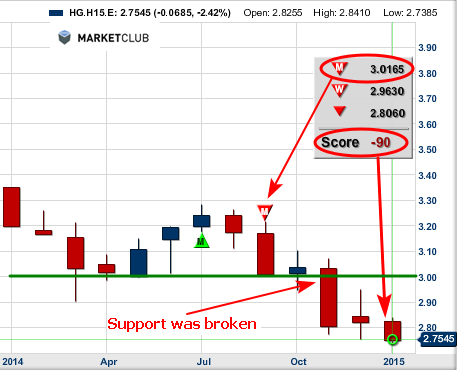
By the way. INO’s powerful Trade Triangle indicator shows a very bearish score at -90 and it was even two months earlier to predict the fall ahead of the chart pattern described today.
Best wishes and lucky trades!
Aibek Burabayev
INO.com Contributor, Metals
Disclosure: This contributor has no positions in any stocks mentioned in this article. This article is the opinion of the contributor themselves. The above is a matter of opinion provided for general information purposes only and is not intended as investment advice. This contributor is not receiving compensation (other than from INO.com) for their opinion.
Just when we chatted I made a quick shot of Oil vs Dollar that you ve mentioned.
https://drive.google.com/file/d/0BzWkCvENvgN0dDBlUDZOc3o0a2M/view?usp=sharing
DXY left scale and green arrows with clone projection.
WTI right scale red arrows with clone projection.
Nice opposite mirroring picture.
When Dollar reaches 100 then Oil gonna slip to 20+ area. Live and see. Best!
I'm thinking copper won't see a rebound until the dollar fades, obviously. And the economic news from the world ticks up in someplace industrial like China, Indonesia, India... The fact that Alcoa had good earnings shows that there's increasing demand for that metal. But copper? If the dollar stay above 90, we shouldn't see to much movement in any commodity. But once the dollar falls below, say, 88, look out!
Dear Anonymole,
Thank you for your comments here and before, I like your way of commenting - detailed and supported by technical and fundamental analysis. You have inspired me for US Dollar index (DXY) analysis to let you know my point about this instrument.
Here is the link for image of DXY chart analyzed by me. http://i62.tinypic.com/9k11xt.png
Please open it in full size as it's broad view for 30 years.
In 2005-2014 Symmetrical Triangle is detected (highlighted in black). It broke out above 84.50 upside.
And it was very important signal. From 1985 USD index was in deep downtrend crashing from sky high at 164 level down to 70 level. Lost more than half!
Now we are in my humble opinion spectating and I hope participating in new era of dollar strength.
Break-out targets triangle's height (highlighted in green double arrow) from the upside of triangle. It's 106 level!
Where do you think commodities and oil will be then? Big question.
But it's not the end of the story. I was surprised myself (I dont cover DXY usually) as the previous high at 121 level can be also reached and even beyond as it's 50% Fibonacci retracement level (highlighted in green).
So for me now it is obvious that we are not going to see 88 anytime soon.
I think that we are at the start of new Super Dollar Cycle - it can take another quarter century!
Hope I described clearly my point.
Best regards, Aibek Burabayev
Full size image link http://oi62.tinypic.com/9k11xt.jpg
@Aibek,
Your long range view of the dollar is useful in understanding how the world treats currencies. Yet I would view the technical side of such a massive macro indicator as the dollar with caution. A technical view can help frame the over all picture as you see that in the past, prices for any commodity can fluctuate shockingly. Thinking though that there are psychological technical price targets that any futures instrument might focus upon is setting yourself up for defeat.
I tend to embrace a broader vision when it comes to such instruments as the dollar. For instance, crude oil's recent fall has unexpected deflationary consequences on currencies like the Pound and the Euro. Who would have thought? Cheaper stuff and energy for the Europeans would pressure their currencies further down -- lifting even more the dollar. Feedback loops are only evident in examination of the macro side of the world -- not within the technical side.
Copper is just such a component in these loops. A affects B which affects C which affects A...
The dollar, affects the yuan which both, when lifting, depresses the price of copper, but can be supported by an inflating yuan causing chinese inflation, but the down trend in chinese manufacturing pressures copper lower, which squeezes the mining companies, which... It's a mess I know. And looking at charts seems to simplify things considerably. Until your expectations, based on the charts, collapse unfulfilled.
Fun stuff.
Dear Anonymole,
People tend to stick to one side of the coin either technical or fundamental and the least are implementing both.
Our dialogue here came to philosophic question which way is the best to understand the market move. It's unsolvable dilemma. Only results are true.
I respect your opinion as market is always 50/50, you never know for sure and only strict risk management is your life vest. And to be succesful in trading we need to have plan B, we can call it "What if I am wrong?". For that reason I always put negative scenario, for instance square shorts in Copper above 3.30, even if I am 200% bearish on it.
One thing - sure you know butterfly effect, so my point is that it is more crucial to determine where the wind blows than to know how butterfly flaps its wings to get an idea of consequences.
Or like my best friend says: I don't know how my car works but I drive without accidents.
Charts are dedicated for those who better grasp visualisation like I do.
Peace!
All good stuff. I love charts myself. I'm trying to learn to temper my technical predictions with global influences. Thanks for the considerate conversation here.