

Reddish Metal Disagrees With GDP Readings
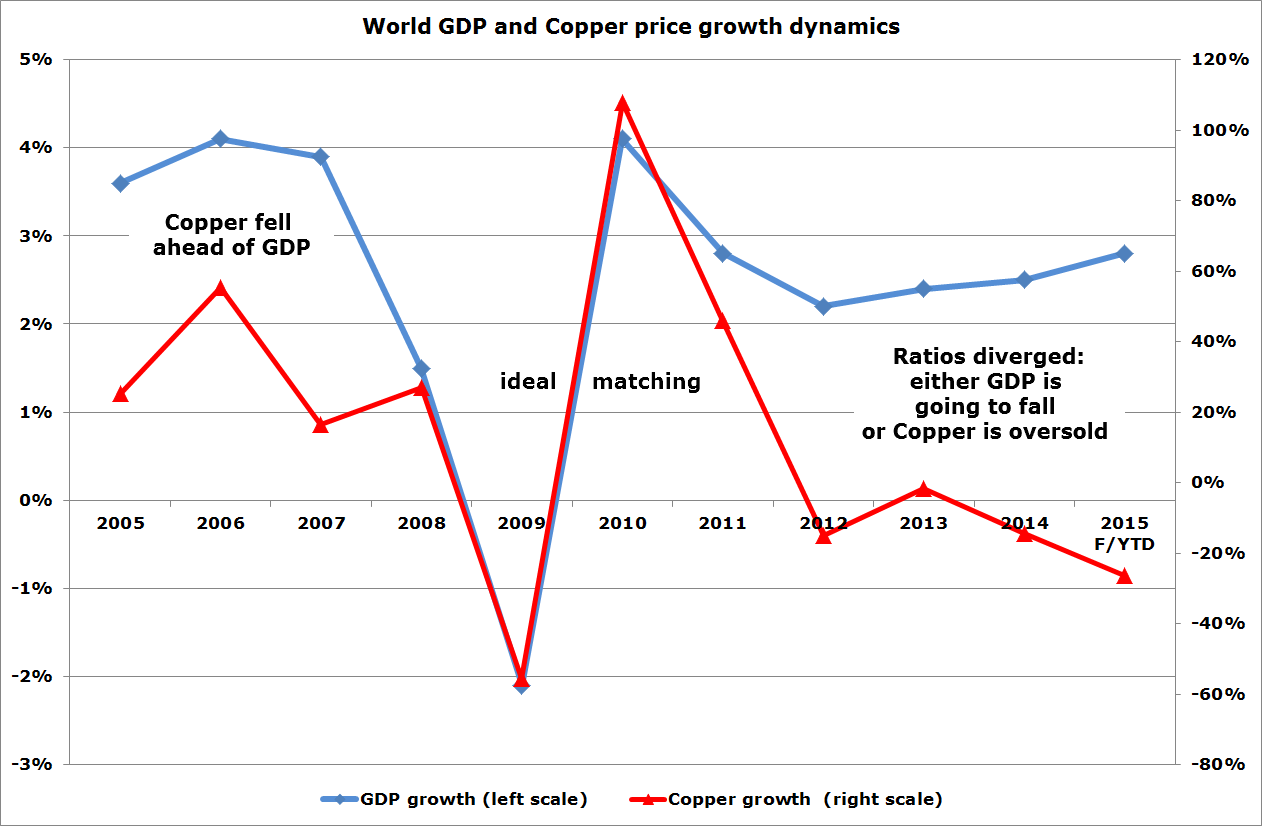
Chart: Aibek Burabayev; Data: World Bank, CME group
Copper is a core element of our everyday life and it will only grow to be even more important in our digital life as we strive for comfort. The diagram above shows it without saying a word.
The 10-year dynamics of the GDP and Copper growth had the same trajectory, at least until 2014 when the ratios diverged. In 2005-2007 the metal had fallen ahead of the GDP with a steeper curve in 2007 and then both indicators met in the collapse of 2008-2009. And then, amazingly, the ratios proceeded to keep together on the graph showing ideal matching from the bottom to the top in 2010.
Copper was the lone passenger in the seat on the roller coaster of 2010-2012 and the GDP quit the game with a slower pace of downfall amid several rounds of QE and China's flat GDP curve.
The ratios totally diverged last year as GDP growth has been frozen around 2.5% and the metal has continued its slide lower and lower. It's not scientific research, but this simple diagram points to a serious discrepancy: GDP readings continue to show pale, but growth, while the price of Copper is digging for the bottom.
This summer both the IMF and World Bank downgraded 2015 global GDP growth forecast for 0.2 percentage points (IMF from 3.5% to 3.3; World Bank from 3.0% down to 2.8%) and maybe we will see one more cut before the end of the year.
China is at the top of the news cycle recently so it seems the Copper price indicator is working properly. Just governments are throwing out more and more life vests to the global economy by printing money and devaluing printed money which balloons the GDP readings amid a bursting metal price. But I guess an exposure is coming soon.
"The Snake Games": Copper Is The Second Fiddle
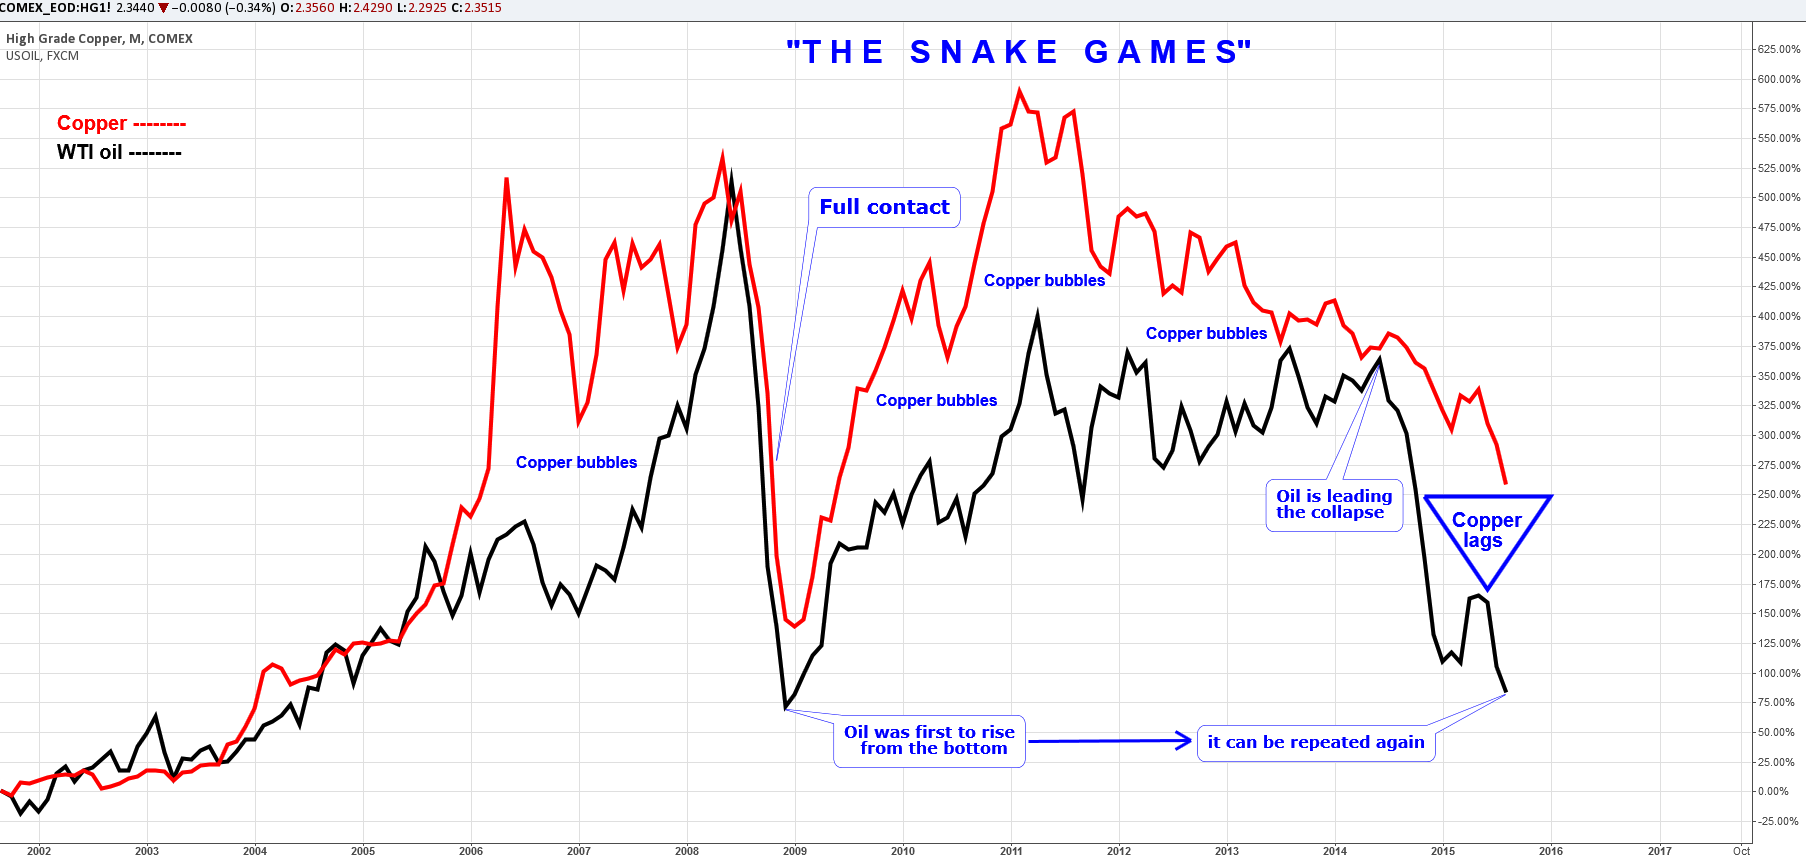
Chart courtesy of TradingView.com
In the chart above I want to show you the comparative dynamics of core life elements. The world needs energy (oil) to go on and the conductor of our thoughts in this digital world and the basis of more and more comfort (Copper).
The graph looks like the chart of two moving averages of similar periods which cross each other signaling regular reversal, so resembling is the trajectory of both Copper and oil. Another analogy is the snake games where the dominant male snake (oil, black line) leads the female snake (Copper, red line).
Copper tends to inflate bubbles over oil's trend as it usually starts in the second position, but then catches up with oil and passes ahead, but only in upside swings. In 2008 there was full trend coincidence of these commodities as it was crisis driven total selloff and Copper sank less than oil, but the latter was the first to reverse the trend later the same year.
As a whole, Copper looks to be driven by oil swings, the last example was the wild oil price collapse in June 2014, the metal has sluggishly followed oil the next month. There is still a big gap between them and Copper lags behind.
As Copper is the economy's health indicator, then oil is its monitor. So to track both Copper and global GDP trends we should watch the oil price development closely. Oil had already signaled reversal at the end of 2008, and we can have another chance of early signs this time again. But don't try to catch the falling knife, be patient, and let it confirm the reversal above $50.
Intelligent trades!
Aibek Burabayev
INO.com Contributor, Metals
Disclosure: This contributor has no positions in any stocks mentioned in this article. This article is the opinion of the contributor themselves. The above is a matter of opinion provided for general information purposes only and is not intended as investment advice. This contributor is not receiving compensation (other than from INO.com) for their opinion.
Then what is your take on a September or December Rate Hike? Do you feel it will drive the price of Copper lower considering the effects it'll have on EM countries?
Dear Sam,
my conclusion for copper is based on pure technical analysis and supply/demand data which is vulnerable to EM countries economy indeed.
Hi,
Just a few questions to follow up on this relationship.
1) Are you stating that you see the World economy performing poorly? Is it possible that China will continue to have a fall causing other EM countries to devalue their currencies as well?
2) With Copper prices falling, and mining companies cutting cost to make up for loses, wouldn't supply decrease => price increase.
3) What contract would you short as a safe bet?
Thank you,
Sam
Dear Sam,
Thank you for questions.
1) I wrote that I have a question in my mind if Copper is falling but GDP is not than either Copper is oversold or GDP will follow Copper down as it was in the past.
Indeed, Chinese economy is cooling despite extraordinary measures taken by government and as Lior (Forex contributor) wrote in his must-read post http://www.ino.com/blog/2015/08/china-devalues-the-yuan-now-what the Yuan even after devaluations is up against USD and didn't even catch up with other asian countries therefore they can halt further devaluation.
2) For two consecutive years (2014-2015 (f)) Copper's balance is in small surplus so there is some room for supply squeeze and with China's downside risk it can be still balanced.
3) I recommended selling Copper trice this year at 2.7545 (January), 2.5725 (February, trade was stopped) and at 2.8310 (May) targets are below $2. I can't recommend to sell it now as safe area is too far (above $3.03). Wait for a good correction up and then sell only on the continuation of fall and put stop beyond intermediate maximum.
January contract will be safe to see if last quarter bring some clarity to global economy outlook.
Best, Aibek
I want to know your documented track record before accepting your recommendations. Please post a very simple spreadsheet showing your trading gains and losses for 10 years. Thank you
Sparrow, that's funny! I mean, yeah, of course you'd want to see a track record for everyone who ever makes a prediction. But would you trust that track record? It would have to be a vetted source. And we know that's not what any of these financial market forums are about. It's about generating buzz to drive ad revenue (or spurious new membership).
But you're right -- Aibek should abstain from recommending anything as should we all. Nobody has a clue as to what the world will bring in the next 1/2 second much less the next week or year.
Dear gentlemen, friends,
Thank you for question and critics Sparrow and to you Anonymole for a warm words.
I am really glad that can express my ideas and thoughts and that you have comments, critics and positive feedback. For me it means that I do something that attracts attention of thinking people, because I also think days/weeks before posting my thoughts and of course I am not going to share thoughts in which I dont believe myself.
Sometimes people share my thoughts sometimes not but anyway idea exists and as Anonymole said that no fortunetellers here just ideas maker.
The key to success is risk management, don't put all your money into a single trade.
Best, Aibek
Dear Sparrow 345,
I think you are the same person, who advised me to cover my short in Gold, in response to my post regarding Gold Bear Trend forecasting around $ 1800, now you can batter judge end result.
Then what is your take on a September or December Rate Hike? Do you feel it will drive the price of Copper lower considering the effects it'll have on EM countries?
Thanks for such good read.
I think, if available, study of Sulphuric Acid's Prise trend is also useful to find some more confirmation, because Sulphuric Acid is deemed as a key indicator to check overall economy.
Dear Rasesh,
First of all, thank you for your active position and always fresh view with explanations.
I will check if I can do anything with acid but most sure you are right.
Best, Aibek
Aibek, nice correlations and presentations.
I wonder if HG hasn't already had all of its bad new, its depression of price already accounted for?
Here is the COT chart:
https://dl.dropboxusercontent.com/u/217878013/Finance/CopperCOT.JPG
And it sure looks like Copper has hit a bottom of sorts. Technically speaking, only, the COT looks like it might fall a bit more, but price sure looks like it's found its floor. I see copper lifting from here. The time to have sold copper was over 3 months ago. Today, it may be time to start picking it back up again.
Dear Anonymole,
Haven't heard from you for quite a time!
Thank you for warm feedback and for sharing.
Chinese meltdown just started though it is too early to judge if it is bottom now.
Your cot report shows nice divergence but as all divergences it can last for some time before full reversal.
Oil has halted its non-stop slide but it can be just a break as market players call for 28-38 target hit downside.
Copper didnt catch up with oil yet so think we will see lower levels and maybe in between we can witness some corrective dead cat bounces.
Best, Aibek