

Gold/Silver Ratio: "Shines Bright Like A Diamond."
Chart 1: Gold/Silver Ratio Monthly
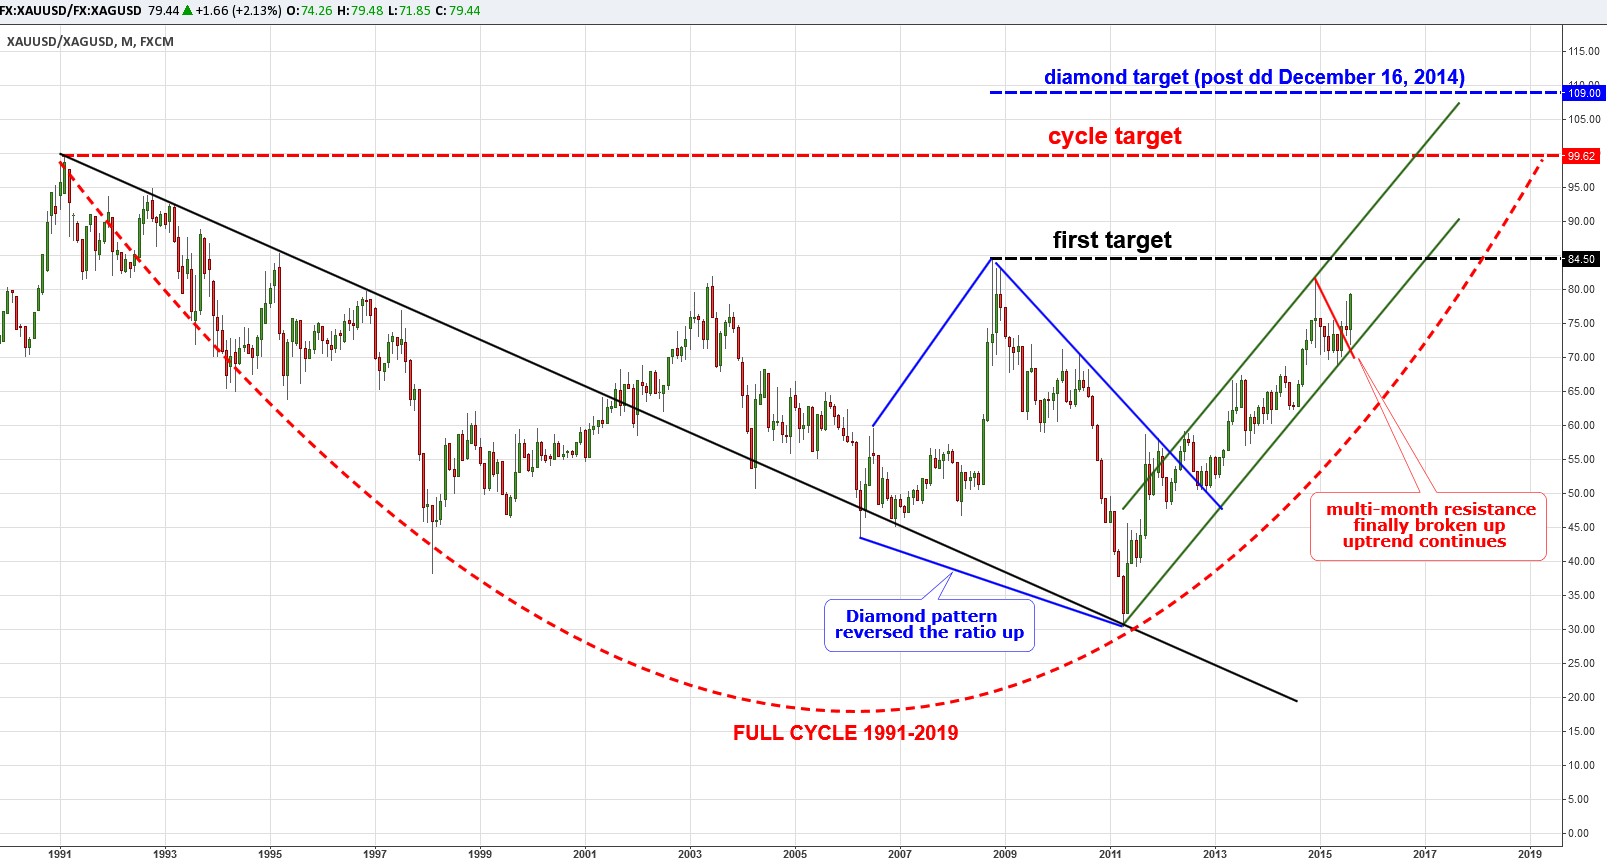
Chart courtesy of TradingView.com
Last December I had written my first post with quite an ambitious target for this ratio at the 109oz level as a possible outcome of a very rare diamond reversal pattern (highlighted in blue lines and the target is highlighted in blue horizontal dashed line). At that time the ratio was at the 72oz level and it has advanced 11% now to the 80oz level.
As seen in the above chart, the breakthrough occurred this month. Before that the Gold/Silver ratio languished in the captivity of the 68-76oz range. In my previous post, the break of the wedge pattern's upside resistance at the 76oz level has been highlighted (red vertical line on the chart) and as we see once the breach happened, the ratio quickly reached the 80oz area. The first target is located at the previous high that occurred in 2008 at the 84.50oz level and it also coincides with the wedge pattern target at the 84oz level.
The Gold/Silver ratio had started to collapse in 1991 from its peak of almost the 100oz level. Three bottoms had been made around the 40, 45 and 30oz levels before it finally reversed up by the diamond pattern in 2012. The red dashed curved line shows the trajectory of the cycle which should reach the initial point level at 100oz to finish it.
We have three bullish targets for the ratio and the last thing to outline is the first support to watch which is located at the previous range and the uptrend downside at the 68oz level.
Gold/Platinum Ratio: Another Win, Gold Dominates Over Industrials
Chart 2: Gold/Platinum Ratio Monthly
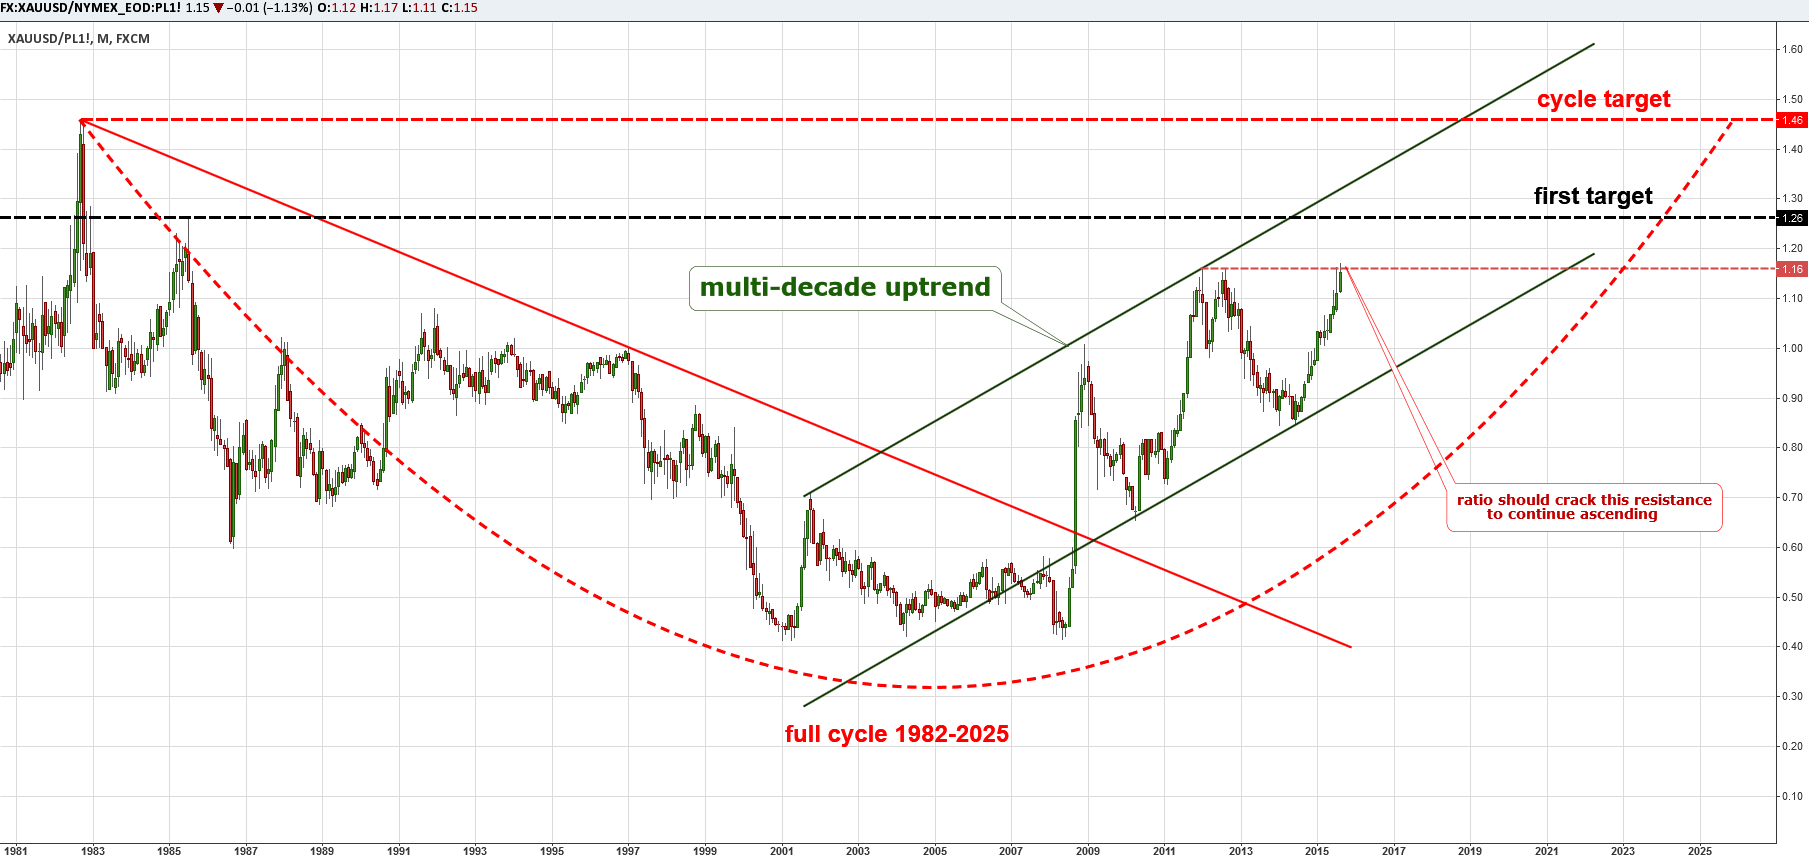
Chart courtesy of TradingView.com
The Gold/Platinum ratio is further proof of Gold's dominance over industrial metals. It's almost the same upside picture on the chart above, but with a longer unfolding period.
The ratio started its downfall 9 years ahead of the Gold/Silver coefficient in 1982 from the sky-high level of 1.46 and the collapse was much more severe than against Silver. I think the main driver was the robust automobile industry development with the higher living standards around the globe which spurred a massive demand for Platinum catalysts as ecology started to head up.
The downtrend had been broken up ruthlessly amid financial crisis when auto-catalyst demand had fallen dramatically bringing the Gold/Platinum ratio to parity at the end of 2008. This very ratio shows that things haven’t become any better, safe haven demand over Platinum has come back with more power after a correction to the 0.65oz level in 2010 and it has sent the ratio to a new maximum beyond the parity at the 1.16 mark.
The Gold/Platinum ratio is very nimble, after reaching a new maximum the ratio made a downward swing to the lower side of a multi-decade uptrend (highlighted in green) reflecting the small inner cycles of the world economy.
Last year quite a deep correction happened below the parity to the 0.85 level, after that, the Gold/Platinum ratio hit the previous peak touching the 1.17oz level. Ahead, we have the last "door" to open; it is a peak from 1985 at the 1.26 oz level before we finish the full cycle at 1.46oz. It is quite possible that reaching the upside of the trend at the 1.30 level will make the corrective move down just below the parity before the ultimate target for the ratio will be hit.
Both graphs show us a clear picture of the market preference; it is again Gold (same as in the case of oil, stocks and currencies).
Intelligent trades!
Aibek Burabayev
INO.com Contributor, Metals
Disclosure: This contributor has no positions in any stocks mentioned in this article. This article is the opinion of the contributor themselves. The above is a matter of opinion provided for general information purposes only and is not intended as investment advice. This contributor is not receiving compensation (other than from INO.com) for their opinion.
Happy Birthday Daddy Aibek!
Dear Aibek,
I must appreciate your efforts to analyse covering multi dimensional perspectives with some innovative chart aspects.
Considering present overall financial situation from currencies or many other concerned factors, At this stage, my general instinct indicates that there is no meaning to get any long term for-castings or predications, as all major markets and world economy is going to form some new equations, and trying to find balancing, just like Crude oil, many counters are showing totally "Never before expected" movements and when we make analysis on the basis or valuation of any specific Currency, say for example, in US Dollar terms or any other Currency, but in that situation,billion dollars question arise like, what about the sustainability or absolute valuation of that particular currency, we used as a data source of such chart? over and above Precious metals, Crude oil and other commodities also going down constantly, but their bottom value and there after movements both are quite uncertain so one should keep away from trying any long term views.
Thank you Aibek, great article! Sorry a few folks did not appeciate.
Dear cferg,
Thank you very much for reading and warm feedback!
Best regards, Aibek
I don't really understand any of this arcane statistical stuff, but what I think is clear is that central banks have been trying to bomb gold in a serious way for at least three years. And seeing as how those same banks are starting to lose control of everything they've been trying to control since the financial collapse seven years ago, it may very well be that gold is poised to make something of a comeback from its recent woeful slump.
Dear venuspluto67,
I dedicated special post about central banks activity in Gold market at the following link http://www.ino.com/blog/2015/06/central-banks-keep-buying-gold-when-you-are-not/ and the outcome of data analysis was not bombing but, on contrary, buying the Gold as the title of the post says.
Anyway, thank you for sharing, have a nice one ahead!
Aibek
я очень рад за ваши информация по этому хочу подключится с уважением пардабай
"I am very glad for your information that I want to connect. Respectfully Pardabay"
Translated using Google Translate - Jeremy
Уважаемый Пардабай,
Очень рад что вам понравился мой пост.
Я регулярно публикую свой анализ металлов в этом блоге и вы можете найти мои статьи по ссылке
http://www.ino.com/blog/author/aibek-burabayev/
Мой электронный почтовый адрес
46****@gm***.com
С уважением, Айбек
Aibek -- you're data mining here. Trying to tease out meaning from data that has no meaning. This is like Elliott wave nonsense, from 1000 samples pull out the 200 that support your argument but ignore the other 800 that don't. Explain the statistical significance, the exhaustive sample data, the postulation in sample and the expected out of sample results, and an example where your theories fail miserably.
Dear Anonymole,
Thank you very much for your opinion.
Usually you share your alternative view supported with link to your charts/calculations to show the idea you have to exchange views.
Best, Aibek
Yeah, Aibek, sorry about that. I'm on a statistical bend right now having seen so many of what I thought were relationships breakdown. So I thought, what if I statistically compile thousands of spreads and try and use them to predict thresholds or trends. It turns out that statistically, predictions from examinations like yours are a dart throw. It's humans and their ability to see patterns where there are no patterns that gives TA so much credence. Take last Monday for instance. Volatility like that cannot be modeled and anyone saying otherwise is selling something. Sanctions against Russia, the worlds second biggest platinum miner, or South African mine strikes (the largest producer) -- those cannot be predicted and overwhelm any TA intelligence anyone can derive from charts. And such world event macro level shocks just cannot be predicted. And TA ignores this.
So, sorry about attacking you and your theories. Please carry on. But remember, they're just theories. If you end up being right, was it skill, or luck? If you end up being wrong, will you (or anyone) come clean and declare their mistakes? Rarely.
I am ok, my friend, no worries, we are live persons with emotions, opinions and thoughts.
You know, compiling different ratios and comparison charts I discovered a lot of hidden things and shared it with readers here. This idea about ratios came from my long FOREX experience as currency crosses (where USD is excluded) are less to not controlled by governments and their charts are more clear and show inner relationships very well, clean and untouched; and so do the metal ratios as they exclude USD and show investors preferences like magic crystal: clean and bold.
To make myself clear: One should trade according to his own rules, risk management is the key for success not an idea itself. Once you have mentioned statistics, I agree that the main thing is to lose less than to win. If statistical probability is 50/50 you will win anyway, but its the question of discipline and that's the problem.
Best of luck,
Aibek
Would you please consider applying your analysis to the Gold/WTI ratio? What targets? Your help would be most appreciated.
Dear Jane,
Thank you very much for your interest in ratios.
In May I gave my Gold/WTI ratio analysis with possible scenarios, you can find it at the following link http://www.ino.com/blog/2015/05/gold-ratios-one-is-free-another-one-is-the-next . There is a full explanation of this rangy market in that post. Gold tried to reach the target given in the post amid severe oil weakness but was again repelled by upside of the range. Below is the link to updated chart, tailored specially for you today, hope I could help you.
https://www.tradingview.com/x/yceAG1Tg/
Best regards, Aibek