

Last time I shared with you a clear signal from Crude oil to short Copper for a good dip down. Oil has dropped as foreseen from the $47.7 level. That's down a good $8 (17%) and it dragged Copper down along the way. This confirms Copper's tight relationship with Crude oil. Copper plummeted for a nice gain from a short position which has reached .35 (15% smaller than from Oil short) on Friday's low ($2.03). My original targets haven’t been met in both instruments ($ 37.7 Oil and $1.9 Copper), and that is why I would like to discuss my concerns with you.
Again we will start with the leading instrument in my regular cross-instrument analysis.
Chart 1 Crude Oil Daily: This Beast Is Too Wild
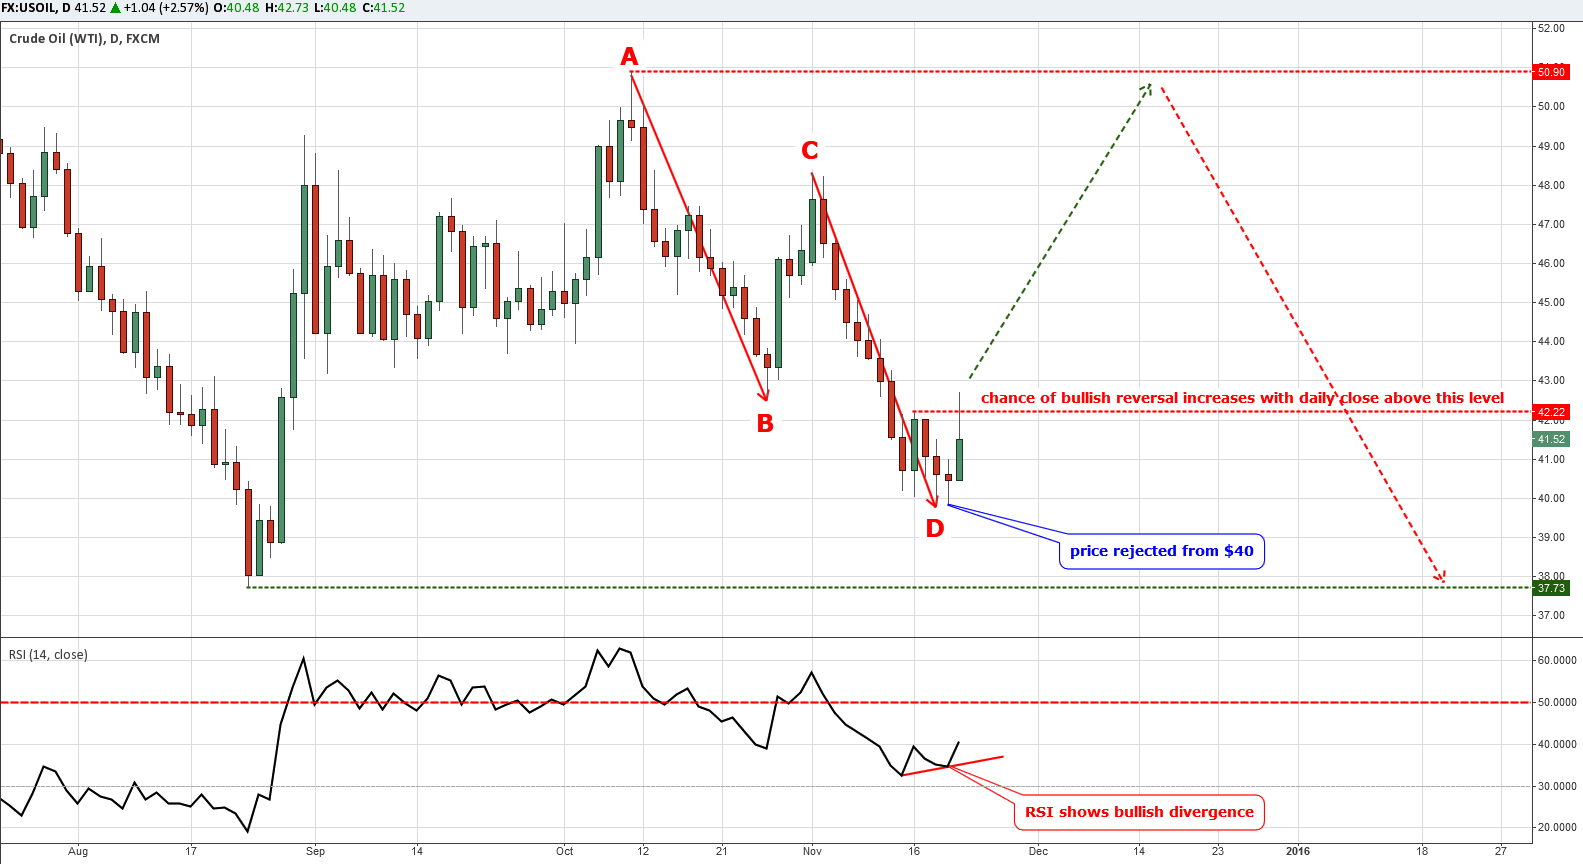
Chart courtesy of tradingview.com
Some traders like the behavior of oil as an instrument as bets are played quickly and you don't have to wait long to know if are you are a winner or not, it’s so wild indeed.
Crude oil has lost $10 in 40 days’ time in two equal segments. The CD segment is steeper than the AB segment as the drop was rapid with a single correction just ahead of the recent low at the $39.9 level, but it stopped right at the 100% mark of the AB segments length, despite the wild move. All three attempts to close below the $40 (round number psychological level) were rejected. The RSI shows a bullish divergence as the current low is higher than the previous which is opposite to what we can see on the price chart above. The Friday candle shows high volatility and a change of the trend as it should close the week lower according to the dominant bearish move during the week, but it failed.
The price has already entered dangerous territory for bears above the recent range top at $42.2, but surprisingly it dipped and closed below it right at the end of the day. The risk of reversal is rising as we should figure out the possible gains and pains. Firstly, the price has reversed just $2 ahead of the target; secondly, we are already $1.6 above the current low; the risk is that we can go to the upside in the same nimble manner as we dropped down and reach the $50 area and lose all profit. The risk is $8.5 (50-41.5)/reward is $3.8 (41.5-37.7) which means to cover short in Copper.
To get the full picture let’s look at the Copper chart below.
Chart 2 Copper Daily: Too much!
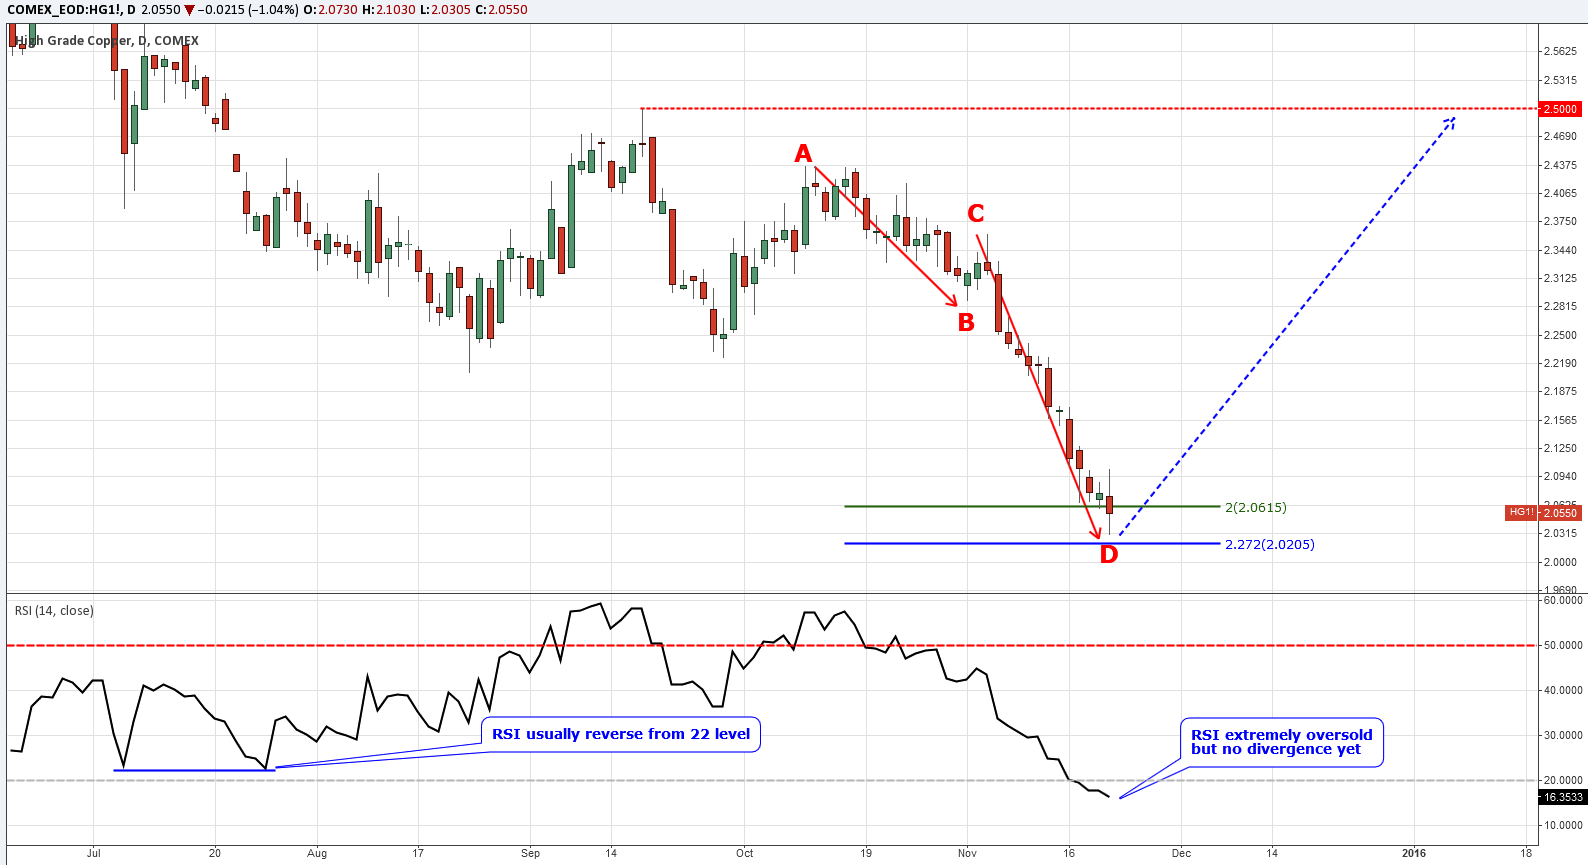
Chart courtesy of tradingview.com
As I said above, Crude oil has managed to descend deeper than Copper in percentage comparison and the metal has done it in a smoother manner without any significant corrections. Usually, the CD segment is greater than the AB segment for 1.618 times, and here we can see the larger expansion of the CD segment which has almost reached a significant 2.272 expansion ratio which points to the exhaustion of the whole move down.
The RSI is extremely oversold. Usually it reverses ahead of the 22 level, and now it is much lower although we can’t see the sign of divergence here. I would like to remind you that we have a time gap in the Copper reaction which gives us a good opportunity to step in at the right time.
In my opinion, we should cover our short position in Copper at the open on Monday to save our decent profits (around 13%) and wait for another good signal from Oil.
Intelligent trades!
Aibek Burabayev
INO.com Contributor, Metals
Disclosure: This contributor has no positions in any stocks mentioned in this article. This article is the opinion of the contributor themselves. The above is a matter of opinion provided for general information purposes only and is not intended as investment advice. This contributor is not receiving compensation (other than from INO.com) for their opinion.