

In my previous update, I recommended covering your short positions in Copper to save a decent profit from the sudden reversal. The next day the price dipped further down to a round figure favoring buyback. Then until today, we saw volatile sideways trading inside of the 2.025/2.125 range. Currently, the metal has traded on the upper side of it. In the meantime crude oil has plummeted to an 11-year low and the two assets have diverged sharply since.
Chart 1: Copper-Crude Oil Comparative chart: The Chain Has Been Broken
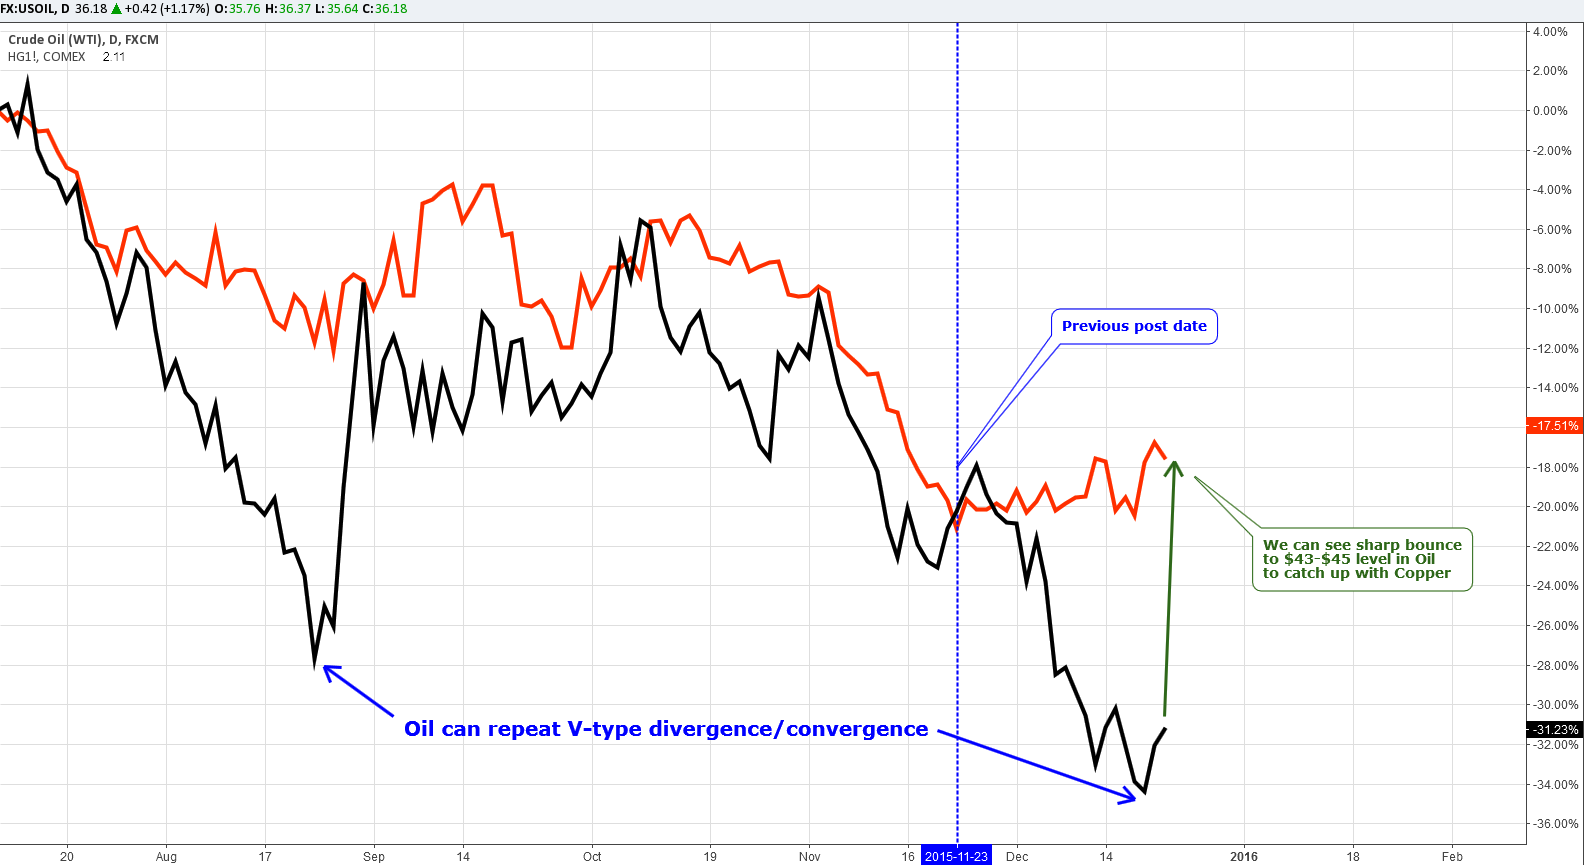
Chart courtesy of tradingview.com
The days following my last Copper/Oil post, Crude oil moved $2 higher as expected, but it couldn't close above the $44 mark and the oversupplied market brought the price down sharply. Despite that, Copper stood still charting a sideways pattern and expanding the triangle. Supply cut fears amid a weakening US dollar have spurred demand for the metal.
Four months ago we almost had the same situation as shown on the chart above. The two commodities have mis-correlated when a sinking oil couldn't drag Copper deep down. Oil then rocketed to the upside from the $37 level to almost $50; it was a wild move that formed the V-shape on the chart. "Black gold" has run higher to reach the metal.
"Buy rumors, sell facts" – you all know this saying. This is the reverse version of it – sell oil on the US export ban lift rumors, buy oil when rumors come true – it worked perfectly. Oil started to slide almost one month ago and when Congress actually lifted the export ban last Friday "black gold" found its bottom that very same day. Let's see if the previous divergence/convergence in correlation gives us the right the clue, the first move is promising, as oil started to converge.
Chart 2: Copper Monthly Chart - On The Edge
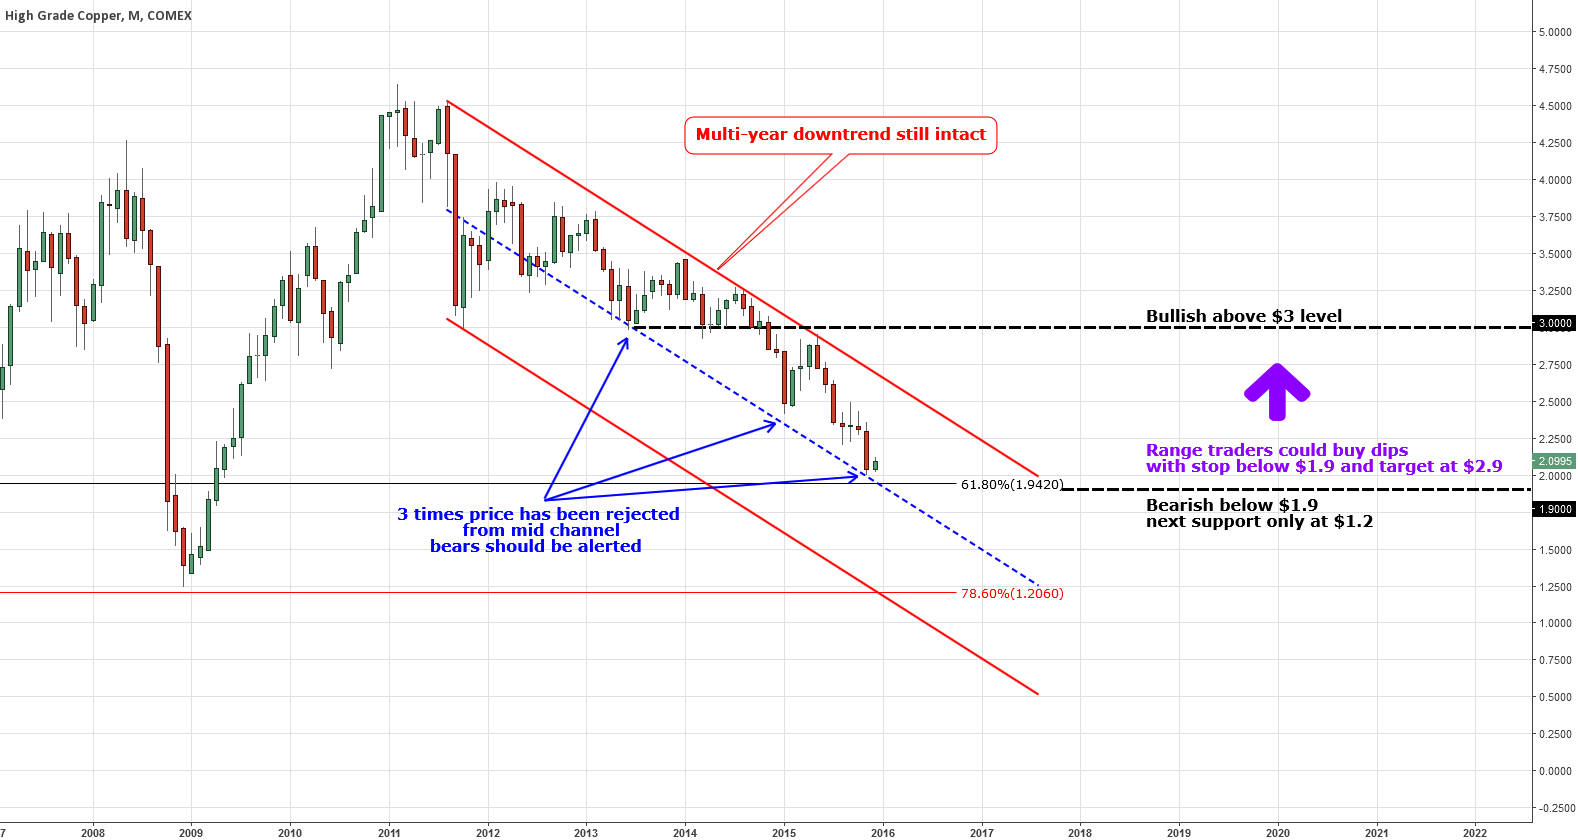
Chart courtesy of tradingview.com
The above monthly chart shows that Copper is still in a multi-year downtrend (highlighted in red). I want to draw your attention to the blue dashed middle of the channel: The last 3 consecutive price attempts to break below it have been rejected. I think bears should be alerted of a possible trend reversal ahead.
The recent dip to a 6.5 year low has met another roadblock – the 61.8% Fibonacci retracement level. This time, I put margins in from the low in the 60's to the top in 2011 to measure the entire move up. Therefore, the current support at the $1.9-2.0 area is double protected: firstly by the middle of the downtrend and secondly by the Fibonacci level.
The medium term view is still neutral as long as the price is within the $1.9-3.0 range. Sellers could appear under $1.9 as there are no substantial supports until the $1.2 level. The strong triple support is there: 78.6% Fibonacci retracement area, the downside of the trend and 2008 year low.
Bulls should be patient and wait until the minor hurdle above the upside of the trend at $2.75 has been triggered. The final confirmation of a reversal will be the break above strong resistance at the $3 level.
Short-term conditions favor a buy on the dips with a stop below $1.9 and the target at $2.9.
Intelligent trades!
Aibek Burabayev
INO.com Contributor, Metals
Disclosure: This contributor has no positions in any stocks mentioned in this article. This article is the opinion of the contributor themselves. The above is a matter of opinion provided for general information purposes only and is not intended as investment advice. This contributor is not receiving compensation (other than from INO.com) for their opinion.
China's numbers, when next released, will renew the down trend for coppor and oil prices.
Deflation will continue to increase into 2016 and 2017 because of too much debt throughout the World.