
Well it was quite a weekend here on the East Coast with a record-breaking blizzard that closed down Washington DC today and made digging out from the 30-some inches of snow quite an interesting challenge. For those of you who live on the East Coast like us, we hope that you and your loved ones were all safe over this dangerous storm.
Now let's take a look at the gold market. This market has been in a bear market for the last four years, almost the exact opposite of the equity markets that have been going up for the last six years. It appears technically that gold is once again coming into style as more investors are becoming leery of the equity markets and the value of their holdings and money in general.
A great deal of this uncertainty has been created by the Federal Reserve Board and the European Central Bank which seemed to have run out of ideas and tools. It appears to this observer that in the last few years these two central banks have literally been winging it on a hope and a prayer. I hope I am wrong on the one as it will make 2008 look like a walk in the park.
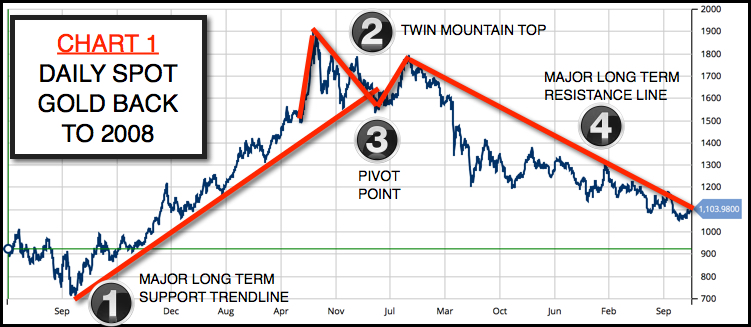
CHART 1
Looking at the long-term chart of gold, you see a MAJOR LONG-TERM SUPPORT TREND LINE that supported gold for several years before it was broken (see figure 1 on the chart). After breaking below the support line, the gold market again tried to rally, but failed (you can see this in figure 2), which created a TWIN MOUNTAIN TOP. Once through (figure 3) the PIVOT POINT, it was all over for gold as it moved into a major bear market that has now lasted just over four years.
The big question is … has the bear market in gold come to an end?
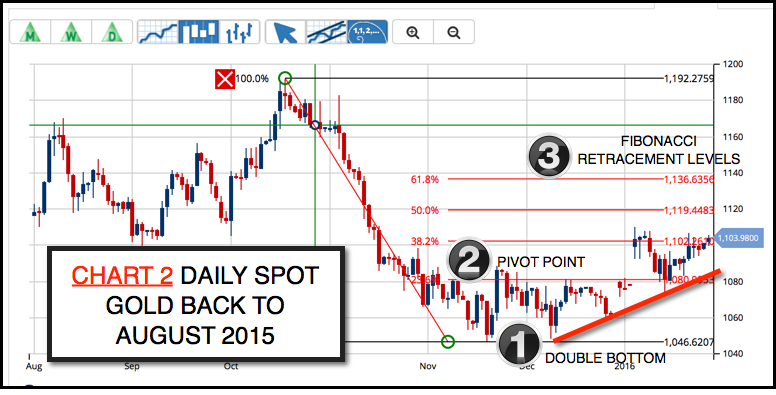
CHART 2
That brings us to the shorter-term time frame, looking at the daily spot gold chart going back to August 2015. This chart clearly shows that the gold market has been moving sideways for the past three months. In fact, when you look closer, the gold market created a DOUBLE BOTTOM in the November-December period of 2015 (see figure 1 on the chart). That DOUBLE BOTTOM was confirmed when the gold market jumped dramatically over the PIVOT POINT (see figure 2) indicating that gold had indeed put in, at least for the moment, a temporary bottom.
I have used the Fibonacci tool to indicate potentially where I believe the current rally in gold can move to (see figure 3).
To use the Trade Triangles successfully in gold, you need to use the weekly for trend and the daily Trade Triangle timing. This is what we have used in the World Cup portfolio and it works very well over time.
We are keeping our fingers crossed that the East Coast gets back to a little more normalcy by the middle of the week and that everything will be functioning like normal. When that happens, I will be able to create some new market videos for you.
Stay focused and disciplined.
Every success with MarketClub,
Adam Hewison
President, INO.com
Co-Creator, MarketClub
Great post! Wish these charts had been posted weeks ago - not 2 days before - for Clubbers not watching Gold, when it first started tipping its hand. Oh, well. . . 1094 to 1119 is betting than missing it completely-- like Mike Seery has, again. Always enjoy Market Club Triangle confirmation of positions i have already taken. Been waiting for my Sell 1119 orders to be filled for weeks.
J,
Thanks for your feedback. We have been talking about gold building a base since the beginning of the year. We have talked about Barrick Gold (ABX), the ETF GLD and also GDX. The daily Trade Triangle for spot gold kicked in this time at $1094.29 that was 6 days ago.
Happy to hear you are in and making some profits.
All the best and every success,
Adam
Hello, Adam
Thank you for following-up on this thread, and for adding to my comment. I was aware that the Weekly Triangle for Gold went Green on Jan 4th, and that the Daily Entry-Trigger Triangle went Green last Wednesday, the 20th-- supported by many technical indicators and tools. . . but the Charts above - this blog post itself - with the near-term and long-term Fibonacci Retracement Targets is dated the 25th: the day before it hit the near-term 50: $1,119.
In your description of Chart 1 you talk about 'over the years' but the whole chart covers only one year ....
Hi Jaysee,
The chart shown is from 2008 to 2016. If you're looking at the months on the bottom it shows Sep. 2008 to Sep.2015 along the bottom.
Best,
Jeremy
Good