

Today when I saw that precious metals started to rise after a correction I detected on the charts my favorite pattern called the Bull Flag. This pattern can change the targets depicted in my earlier gold and silver posts, better say enrich them.
Chart 1. Gold Daily: Beyond 1300!
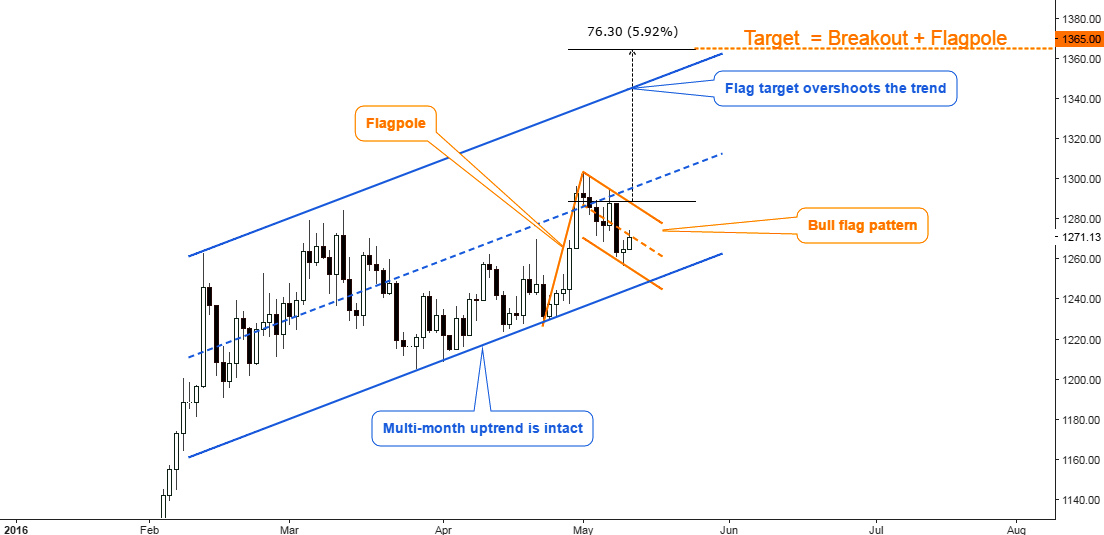
Chart courtesy of tradingview.com
Gold is in the blue multi-month uptrend. The angle is not as sharp as it was at the start of the year, but it still can take gold to fresh highs.
The Bull Flag Pattern consists of two parts – the first is the flagpole (highlighted in vertical orange line) and the flag itself (orange trend channel). Gold reversed from the downside of the flag and now is trying to break up the midline at the $1272 level.
The true breakout means that the market should take off from the resistance located on the upside of the flag at $1289 to accomplish the pattern. The target is located at the distance of the flagpole applied to the breakout point. It was marked by the dashed horizontal orange line at $1365. It means that the current market is strong enough to take the price above both the previous post target at $1307 and beyond the upside of the blue uptrend at $1345.
Chart 2. Silver Daily: New Ten!
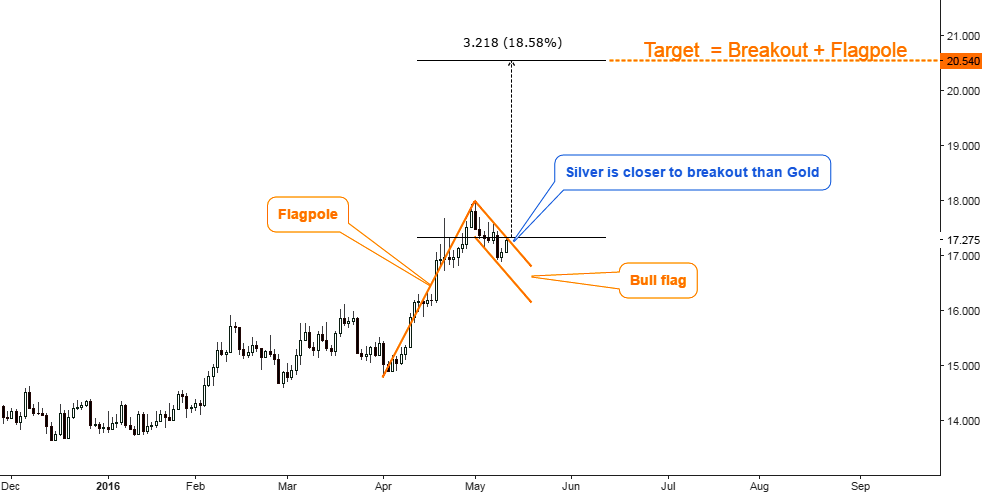
Chart courtesy of tradingview.com
Silver is strong indeed as you can visually compare the position of the price of both metals in the flag and you can find out that this metal is closer to the breakout point than gold hence it's stronger.
The ultimate bullishness of silver is also seen in a larger flagpole and a shorter flag. I will dedicate one of my next posts to the Gold/Silver ratio to illustrate the strength of the silver.
The price should break and close above the $17.30 level to confirm the pattern. The target is located at the distance of the flagpole applied to the breakout point at $20.54, a sweet target for the bulls as we will change the ten ($20) and it’s a very important psychological factor. This ambitious mark will beat the previous silver post’s target set at $18.23.
You can see from both charts that sentiment is still bullish. I mean tactical short term view. Top metals move upside without serious retracement which would be marked as medium-term corrections. I updated the goals for you to keep up with the market stream. I expect the medium term pullback after we complete these flags. Let’s see what it will bring us.
Intelligent trades!
Aibek Burabayev
INO.com Contributor, Metals
Disclosure: This contributor has no positions in any stocks mentioned in this article. This article is the opinion of the contributor themselves. The above is a matter of opinion provided for general information purposes only and is not intended as investment advice. This contributor is not receiving compensation (other than from INO.com) for their opinion.
Looks good to me, thanks for pointing it out!
Dear Frank,
Thanks for a warm feedback.
Apart from all pattern, I am confused about just one question that "Why Gold is galloping between $ 1200 to $ 1300 Since Mid February to the present date?"
I believed that this is purely a "Congestion" and it has both break-outs probability like lower or upper, so at this juncture, i am neither Bull nor bear we must wait for $ 1150 and $ 1350
Dear Rasesh,
The $1200/1300 'Congestion' that you have mentioned is the period of 'Recognition' of upside trend after the rocket move at the start of the year.
As I've mentioned in my post that the angle of the current uptrend flattened and that's why the range narrowed. It tells us about imminent retracement after we will finish current move upside amid bull power exhaustion.
Dear Aibek,
ok, and Thanks, let us watch, Bull power is quite because they have no Mass Support.
You are welcome, Rasesh!
Hope you are right!
Dear Kenny,
Let's live and see!
The number 1365 is an interesting number because it is 180 degree from 1303 on Gann's Hexagon chart. The other number is 1344, another 180 degree from 1046, 1283 on Gann's Hexagon chart. Therefore, these could be the number we should watch closely.
Dear Kenny,
Thank you for extended comment, I would love to see that Gann's chart if you share the link to the image somehow.
Surely. But I will have to do it tonight after work.
Hi Aibek: I am unable to paste the chart on the reply box. However, if you give me your email address, I would be able to send you that.
Kenny
[email protected]
An email has been sent to the above email address regarding 1365 on Hexagon Chart
Thank you Alaak, that is strong pattern yes. too many say cott number showing a crash it doesnot seem so affirm?
Dear Kailesh,
I think we are going to make another jump before good technical correction.