

Dear readers, I am very grateful to get all your feedback and suggestions that you kindly share with me all the time! Rasesh Shukla, one of our regular readers asked about the Emerging market currencies and particularly about Indian rupee in a comment this month. And I am pleased to share my thoughts with all of you in this post.
Chart 1. 5-Year Dynamics of Top FX vs. EM FX
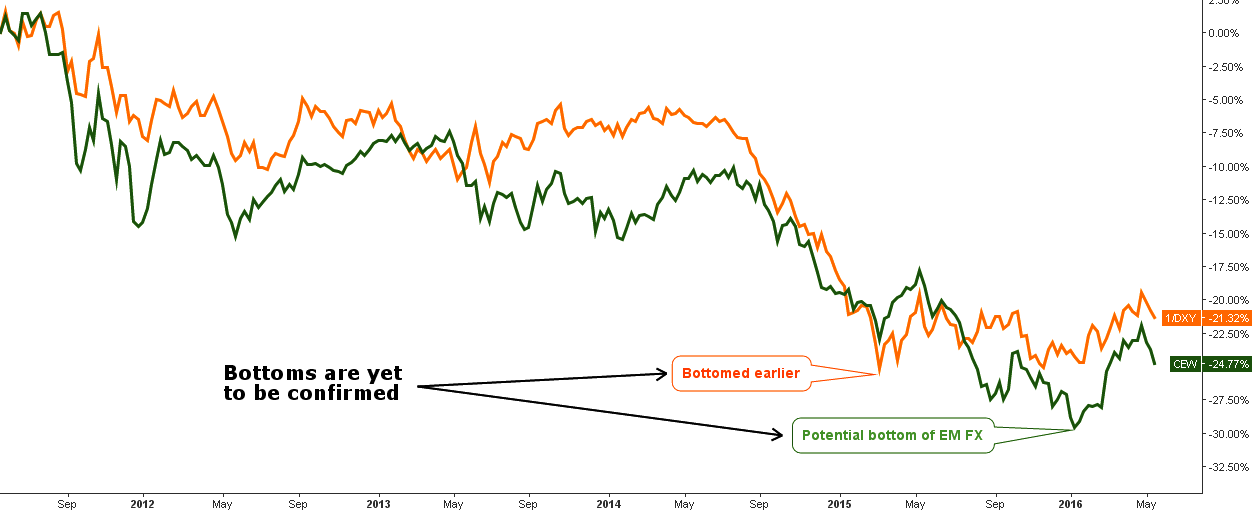
Chart courtesy of tradingview.com
I want to start with the comparison chart of the top currencies presented by inverse dollar index, consisting of 6 currencies: Euro, Japanese Yen, British Pound, Canadian Dollar, Swedish Krona and Swiss Franc (orange line) versus the emerging market currencies presented by WisdomTree Emerging Currency Strategy Fund (CEW, green line). The former is quite representative, it tracks the value of the following 15 currencies: Mexican Peso, Brazilian Real, Chilean Peso, Colombian Peso, South African Rand, Polish Zloty, Russian Ruble, Turkish New Lira, Chinese Yuan, South Korean Won, Indonesian Rupiah, Indian Rupee, Malaysian Ringgit, Philippine Peso and Thai Baht.
As we can see for the past 5 years, the dollar was indisputable both by the top currencies and the emerging currencies. The inverse dollar index hit the -26% at the bottom last March while the CEW was hit even harder with -30% loss at the start of this year.
The top currencies have managed to secure the bottom shaped last year, but the EM currencies couldn’t resist the king currency and dropped one more time to a new low. If the dollar has topped already as was suggested in my first post this month, then we can take the April breakups in both instruments above the October 2015 maximum as harbingers of a forthcoming bullish reversal.
The game has now been between the bottom levels and the last May peaks. Trend reversals are tricky, and we should wait for a better confirmation as to not catch the falling knives.
Chart 2. 5-Year Dynamics of Top Emerging Currencies
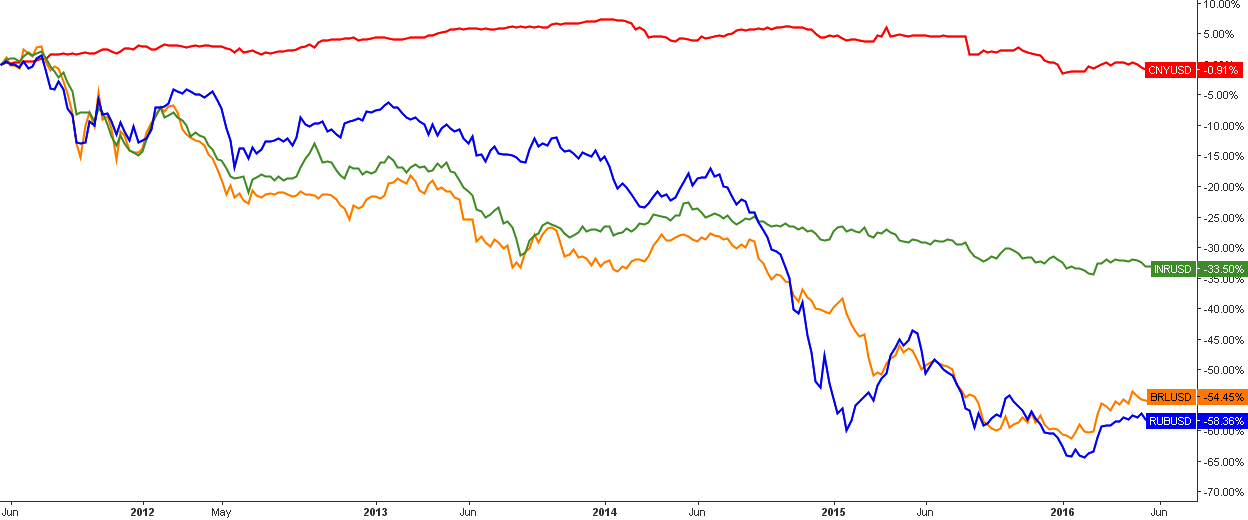
Chart courtesy of tradingview.com
On the chart above, I put together the four top EM currencies (by nominal GDP of their countries) to find a winner and a loser. It’s amazing for the past 5 years; emerging currencies showed the same dynamics as their population ranking. Both the Brazilian real and the Russian ruble suffered the most as they lost more than half of their value amid weak commodities. The rupee has lost the third of its value and ranked second with a good margin.
The yuan is the strongest among the pack, it could even hit the dollar at the halfway making some positive gains above +5%, but at the finish, it dropped down to -0.91%. We can call the Chinese currency an alter-ego of the Dollar as it almost didn’t move and it could be used as the alternative shelter to the dollar as even gold lost almost 20% over the past 5 years (up to date). Of course, the magic of the flat dynamics of CNY is a fruit of manual management of the Chinese central bank.
Chart 3. Gold vs. Indian Rupee Monthly
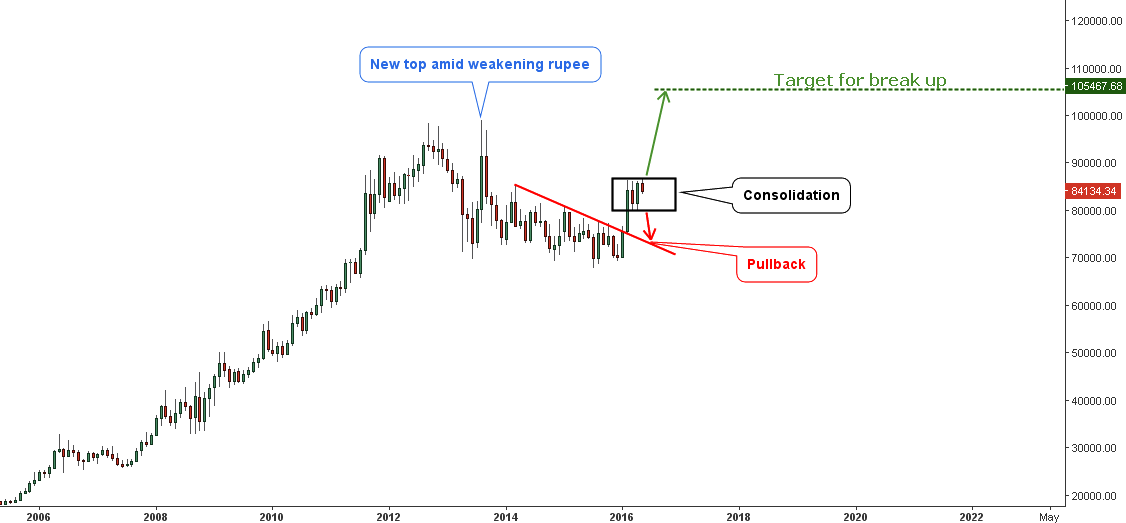
Chart courtesy of tradingview.com
A soft rupee facilitated the major moves to the upside for gold. We all know that gold topped against the US dollar in 2011, but weak a rupee let the gold make a new high in 2013 at Rs 99234 vs. Rs 98520 in 2011. In the rest, the chart looks similar to the main gold/$ chart with softer downsides and sharper upsides due to losing rupee. Gold bottomed only a half year ago, and if EM currencies including rupee start to rebound against the dollar then we can face decelerating progress of gold in EM markets.
The gold/INR advanced above the red resistance line in February and was nimble to break all the previous highs preceding the major top. This is a very strong bullish signal as the market couldn’t even break above the previous high against the dollar.
Now the market stalled in consolidation (black rectangle), the range is Rs 80k-87k. The break upside is favored and it could take the price much higher, even above the 2013 top to the Rs 105k area. The drop below the rectangle should be considered as the pullback to former resistance.
Intelligent trades!
Aibek Burabayev
INO.com Contributor, Metals
Disclosure: This contributor has no positions in any stocks mentioned in this article. This article is the opinion of the contributor themselves. The above is a matter of opinion provided for general information purposes only and is not intended as investment advice. This contributor is not receiving compensation (other than from INO.com) for their opinion.
In India, Gold is trading in a lot size of 10 Grams Unit, which is around 28,800 as on today's currant rate. I never understand Gold price in India, and price determination process thereof.
Also I just cant even co-relate Gold and US Dollar against Indian Rupee (INR) if we check consequent historical Highs and Lows thereafter, we just observe random movement, without any co-relationship, as per data, stated below.
Gold registered it's all time High of $ 1920.84 on 06=09=2011, and there after, Gold form a bottom of $ 1050.54 on 03=12=2015. Against this Gold price in India have made it's All time high of Rs. 33,265 on 28=08=13, around two years later then International market, and form a bottom of Rs.24,900 on 24=07=2015 which was also around 6 months ahead of world market.
Now if we check this against USD V/S INR exchange rates, that was at it's all time high of Rs. 69=23 against 1 USD on 30=08=2013 and bottom of Rs. 58=70 on 22=05=2014
All above data clearly point-out that there is no co-relation between either Inter National Gold price and Indian Gold price or USD and INR Exchange rates and Gold price.
With a view to above, and as per my study, we just cant predict any inter connection between Inter National Gold price and Indian Gold price, also there is no co-relation within Gold price and Exchange rate, and all movement of international Gold price, Indian Gold price and USD / INR Exchange rate all are having their own separate movement without any significant inter connection, and we can not predict price of any of them compare to any other factors as discussed.
I miss Adam Hamilton''s frequent postings: charts, and technical analysis of the various markets (NASD, DOW, Gold.Oil.etc.)
and his analysis of individual stocks to buy or sell, as well as his breakdown of support and resistance areas to watch for.
WHERE IS HE???? I NEED analysis of Comex spot GOLD after today''s SELLOFF to the 1228 level.
Where is the next support level for Gold, and is likely to continue downward after today's selloff?
PLEASE ADAM share your analysis with us all!!! I NEED YOUR expert INPUT!!!
HELP ADAM. PLEASE!!!
Hi kalman,
Adam will be doing an update today and it will be posted at 1pm EDT today. Stay tuned.
Cheers,
Jeremy