

What is fear? It’s our emotion about something uncertain or unknown as it is natural for human beings to avoid risks. Someone said that to stop fearing it is good to face it as quite often it is only our mental illusion and has nothing common with reality. Another wise person advised looking at a larger perspective to cut the noise of the market to keep above the vanity.
I took both pieces of advice and combined them into a single weekly chart below.
Chart 1. Gold Weekly: Roller Coaster – Let’s Face The Maximum Fear
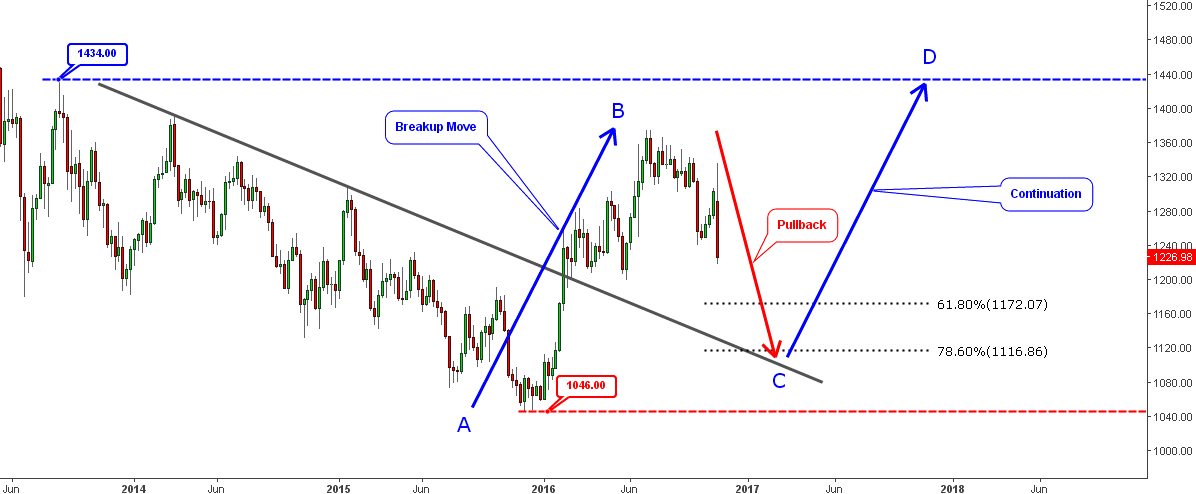
Chart courtesy of tradingview.com
On the multi-year chart above, we can clearly see that the global map of the market didn’t change for the past 3 years and we are still at the levels seen in the three previous years. Almost a year ago at the end of November 2015, gold hit a new low and set the new edge of the range with a fresh downside at $1046 and the upside at $1434 (August 2013 maximum). Right now the price is almost at the center of the range.
The event of the year was the breakup of the black multi-year resistance line this February. After a series of minor pullbacks, gold moved higher to hit a yearly maximum at the $1375 mark in July at the peak of the summer. The gold bugs were excited as their lovely metal was shining brighter and brighter. But then the market put gold on a ‘roller coaster’ with short swings back and forth at the start and the larger zigzags later on. And you can see another analogy here – whether you scream or not, the attraction won’t stop until the end. To limit our fear, we should keep in mind that the roller coaster, no matter how big it is, will stop on the downside and it is just an attraction with time and distance limits.
One of the possible scenarios within the current range is the large zigzag depicted in 3 arrows. Before I continue with details, I would like to tell you about trading such zigzags. The zigzag usually consists of the sharp moves and requires a good reaction as it is good to cover position when you have the first countertrend move on a lower time frame. That’s it, don’t wait, just cut the position with a profit you have as the corrective structures have up to a 78.6 % depth of retracement. I think it's an unbearable pain to see your profit is melting for 78.6% (at least, as it is a big luck to buy low/sell peak). There is no need to be stubborn during such a structure of the market. The great Muhammad Ali said – “float like a butterfly, sting like a bee, ” and that’s true for traders. A losing position or melting profit put a huge psychological burden you and then you can’t float like a butterfly not to mention about stinging like a bee.
The first blue up arrow shows the breakup move (AB segment). Now we are in a downside correction highlighted with a red arrow. Yeah, it’s that very roller coaster I was talking about two paragraphs above. So, let’s face the maximum downside risk to get rid of the fear and take a sober view. I set the downside distance for the red arrow at the deep 78.6% Fibonacci retracement level at $1116; it’s a bad dream for those who are still in. By the way, this level almost coincides with the pullback area to the black trendline located at $1100 level though it’s double strong. If the price would bounce off that area, then the blue CD segment (equal to AB segment) showing the continuation upside would hit the upside of the range. Once again it shows the magic power of numbers.
Ok, now we understood the maximum risk and saw the global picture. I prepared the lower time frame chart below to show you what’s happening inside of the red arrow. This is a very useful exercise to cut emotions as your mind focused and there is no spare capacity for emotions. This effect is very well portrayed in the book “The psychology of trading” by Brett Steenbarger.
Chart 2. Gold 4 Hour Extra Squeezed: Is This The End?
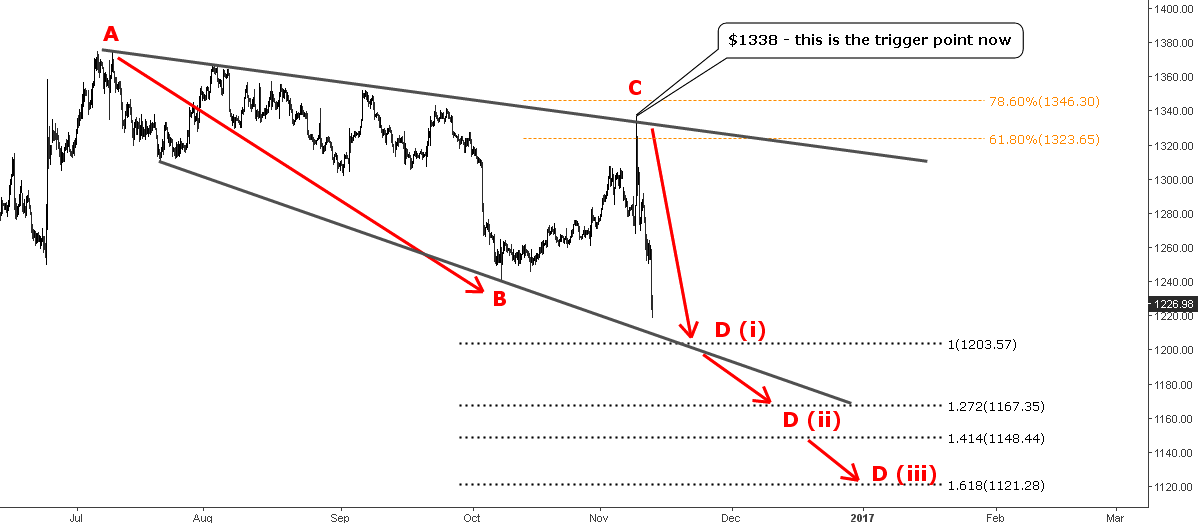
Chart courtesy of tradingview.com
I broke down the current correction into two red segments. The AB segment was prolonged as it was creeping down with a mild angle. Then there was a multiple zigzag correction (B to C), which reached between the 61.8 and 78.6% Fibonacci retracement levels of AB segment at $1338 on Trump’s lead. After that, the huge ‘hangover’ drop (>$100) followed and almost reached the area where the CD is equal to AB segment at $1203 marked as D(i).
As you can see, I added more ratios down to measure the CD segment as while we are below $1338 (the first upside trigger point now) the further drops can’t be ruled out. The D(ii) point is at the 1.272-1.414 ratio between the $1167 and $1148 marks. The last D(iii) point is located at the distance of 1.618 *AB at the $1121 mark and it is very close to the 78.6% Fibonacci retracement level set in the Chart #1.
I contoured the correction with the black expanding channel. The price, despite the crazy moves, is still inside of it. This is what we call a magic of the trend. It has managed to contain a severe drop of the metal, although it has limits and further ratios are beyond the trend. Let us see where the magic ends.
Now we know that the maximum pain level is at $1100 mark. Besides that, the tactical 4H chart shows that the first upside trigger is at $1338.
Intelligent trades!
Aibek Burabayev
INO.com Contributor, Metals
Disclosure: This contributor has no positions in any stocks mentioned in this article. This article is the opinion of the contributor themselves. The above is a matter of opinion provided for general information purposes only and is not intended as investment advice. This contributor is not receiving compensation (other than from INO.com) for their opinion.
What good does looking at fibonacci's do when gold and silver are being manipulated by the central banks?
Gold Bellow $ 1250 itself is a serious concern, and will even worst if break the support of $ 1195.