

It’s amazing how an updates’ timing can coincide with an interesting chart pattern that’s shaping up or trendline reactions. This time I spotted a Symmetric Triangle pattern as I was preparing this monthly update. I am happy to share it with you in the chart below.
Chart 1. Silver Monthly (Zoomed): Symmetric Triangle
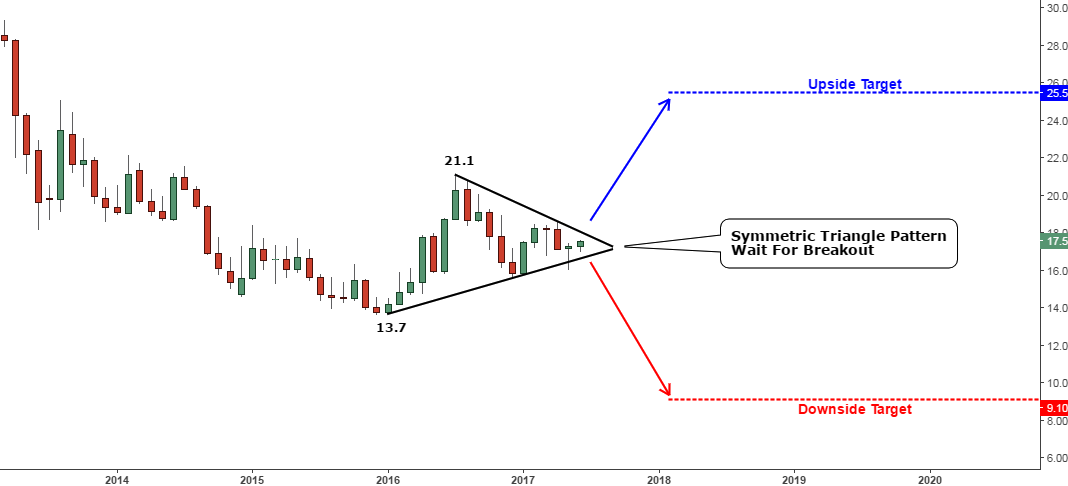 Chart courtesy of tradingview.com
The market got stuck for more than one year inside of the black Symmetric Triangle pattern. It shows that neither bulls nor bears could change the balance of the market as price volatility on the monthly chart faded and we reached the apex of the triangle where the trendlines converge.
Last month silver tested the downside of the figure – the price briefly dropped below the trendline but couldn’t stay there and moved back inside of the pattern making that a false break. Visually, there is room for one more monthly candle in case this month doesn’t deliver the breakout of the pattern.
Triangles are regular patterns on my charts so you already know how to calculate the targets. I measure the height of the pattern from the highest peak at $21.10 to the lowest valley at $13.7 (the height = $7.4) and add it to or subtract it from the breakout point. The upside trigger point is located at the $18.1 mark, therefore the upside target is set at the $25.5 level. The support would be broken below the $16.5 level and the downside target is located at the $9.1 mark.
We should closely watch both sides of the pattern for further clues. The breakout and a close above or below the pattern is needed for trade validation.
The next chart shows the big picture and the major levels to watch.
Chart 2. Silver Monthly: Major Levels To Watch
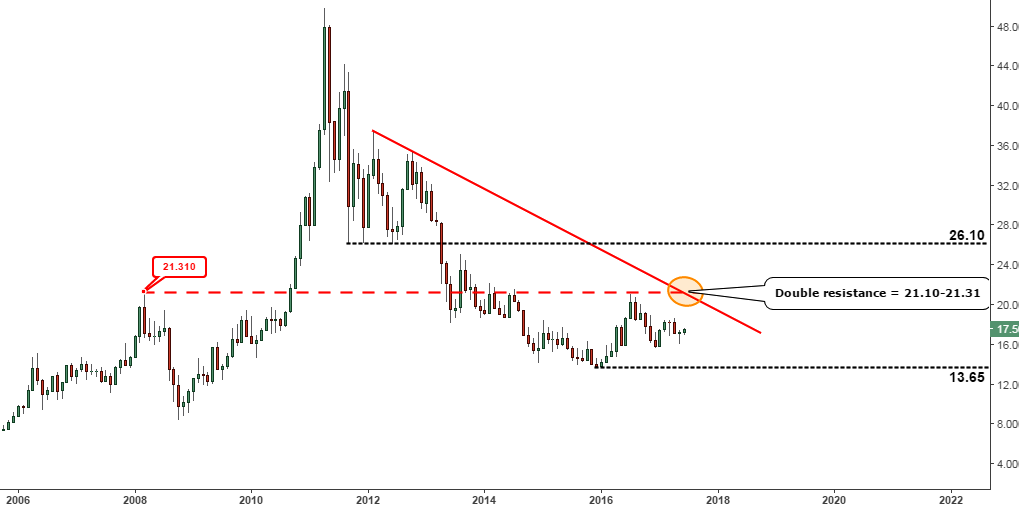
Chart courtesy of tradingview.com
The market has a good memory and historical levels could influence the current market. We can see how the 2008 peak price ($21.31) echoed even after eight years in 2016 putting up a strong barrier (highlighted in red dashed horizontal line) for the silver, which it couldn’t surpass. In addition to that, there is another object from the past – the red trendline resistance, which originates from the 2012 peaks. It is interesting that it intersects the above-mentioned horizontal resistance right above the current monthly candle making a double resistance for silver at the $21.10-21.31 level.
I added two more levels to watch to the opposite sides of the current price:
1. The former support at the $26.1 level, which now acts as a strong resistance; it perfectly corresponds with the Symmetric Triangle’s upside target. (Chart 1)
2. Strong support at the major low established at the end of 2015 at the $13.65 mark. The downside target for the Symmetric Triangle is set much lower and it fits much better with the 2008 low at the $8.45 level, but we shouldn’t ignore it anyway as it proved to be powerful reversing the price to $20+ area.
Intelligent trades!
Aibek Burabayev
INO.com Contributor, Metals
Disclosure: This contributor has no positions in any stocks mentioned in this article. This article is the opinion of the contributor themselves. The above is a matter of opinion provided for general information purposes only and is not intended as investment advice. This contributor is not receiving compensation (other than from INO.com) for their opinion.
The "Federal" Reserve will more than likely send JP Morgan to the futures markets to manipulate it down as gold is in competition to the USD. They focus on silver as it is thinly traded and therefore the easiest to manipulate. When the price of silver goes down, so does the gold price. The Fed is running the biggest scam in the world. They are a huge parasite whose shareholders include international banks, so often JP Morgan will team up with one of them. The USA has been usurped with these bankers who wanted and got perpetual debt and most Americans don't know this. Some even believe what your mainstream media tells them. If I'm from the other side of the world and know this, how come many Americans don't?
Google what G Edward Griffin has to say. He can tell you about this and much more.
Yes, this really was something!
The Market sure has a good memory.
thanks, very informative! Just want to make sure as I do not see a ticker that it is SLV?
Ron,
SLV is the ticker symbol for the Silver ETF.
USLV is the ticker symbol for the three time bullish leveraged Silver ETF.
Profitable trades !