

There is not much change in the precious metals charts, and that gave me a chance to find some trading setups for stocks. In this post, I would like to share my analysis of the stocks starting with the letter “C.”
Table 1. Filtered Stocks For Letter “C”
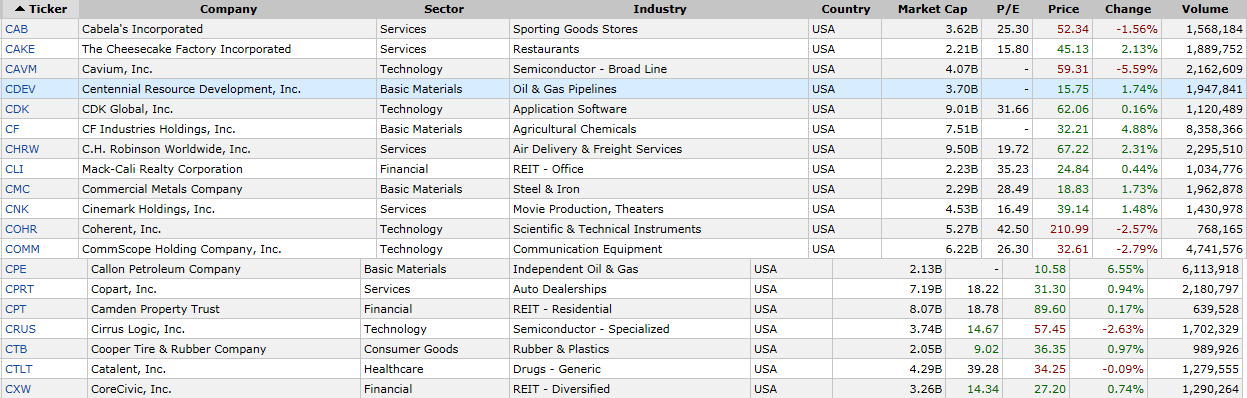
Chart courtesy of finviz.com
Out of the 19 screened stocks I’ve selected three to analyze as they have clearer chart structure: CAVM, CNK, and CPE. All of them have potentially good short setups. It looks like not all companies could keep the pace with the rising S&P 500 index which continues to make record highs one after the other.
Chart 2. Cavium Inc. (NASDAQ:CAVM) Weekly: Potential Double Top Sell Setup
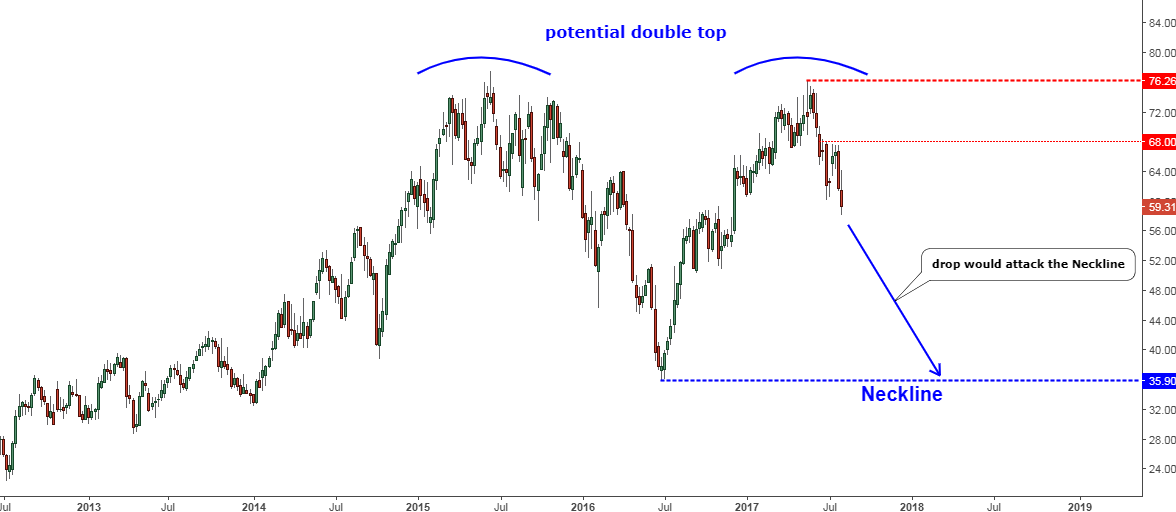
Chart courtesy of tradingview.com
Cavium Inc. (NASDAQ:CAVM) could have a potential Double Top reversal pattern shaping up in the chart after the long-term uptrend has been exhausted. Both tops were established in the $77 area. The second top has a clean shape with short zigzags quickly reaching the maximum point. After the reversal in May, the chart structure keeps clean with sharp zigzags to the downside.
The minimum target for the drop is located at the Neckline (blue dotted line) of the Double Top pattern at the $35.90 mark. There are two horizontal resistance levels you should watch to avoid excessive risk for this short. The closest is at the $68 level where the maximum points of the previous small consolidation have been established. And the second one represents the current major top at the $76.26 mark.
Let’s look into CAVM’s financials.
Table 3. CAVM Financial Highlights
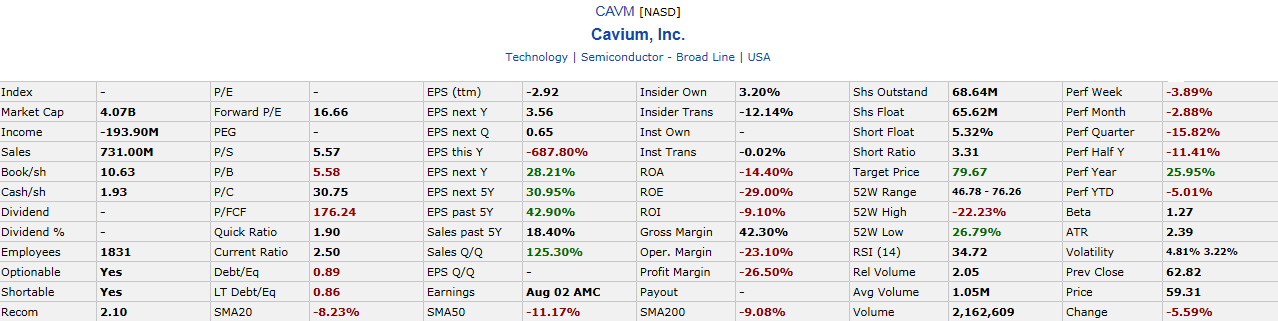
Chart courtesy of finviz.com
Short pros: High debt burden; ROA-ROE-ROI – all negative; price ratios are highly overvalued; insiders are selling; the company makes losses.
Short cons: Low short float so far.
It looks like the fundamentals are screaming negative outlook. There is nothing I can add here.
Chart 4. Cinemark Holdings Inc. (NYSE:CNK) Weekly: Potential Double Top Sell Setup
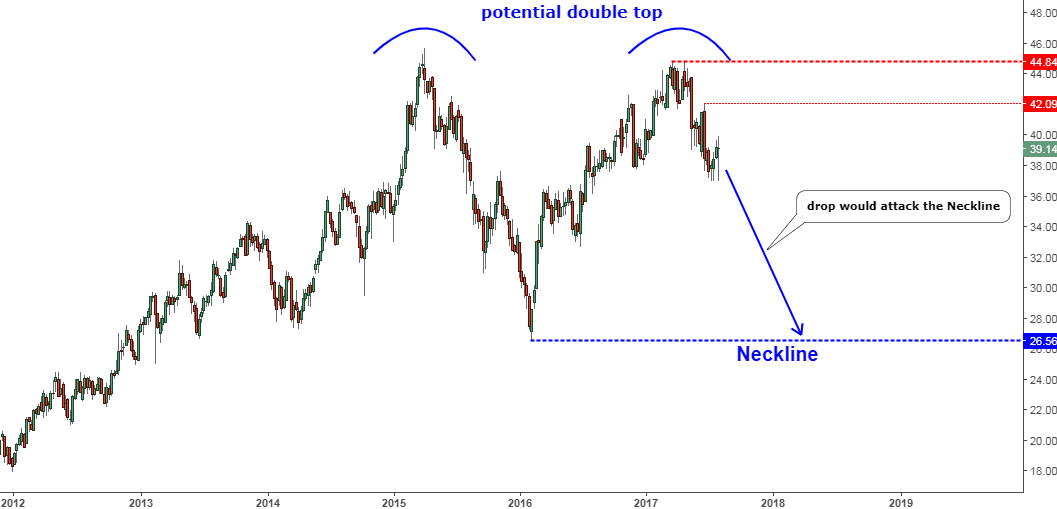
Chart courtesy of tradingview.com
It’s amazing that in the same letter and the same period there are two similar chart structures. The Cinemark Holdings Inc. (NYSE:CNK) chart repeats the structure of the above-reviewed CAVM graph. The same potential Double Top pattern is shaping. Two things are different – the first top here has a cleaner chart structure, and currently, the price is making the second consolidation while CAVM only did that once.
The Neckline (blue dotted line) offers the minimum target area for the current drop. It is located at the $26.56 mark.
I’ve added the red dotted horizontal resistance levels to give you an idea of limiting the risk for this short setup. The first and the closest one is located at the top of the previous consolidation at the $42.09 mark. The next one is set at the highest point of the second top at the $44.84.
Let’s read it’s fundamentals below.
Table 5. CNK Financial Highlights
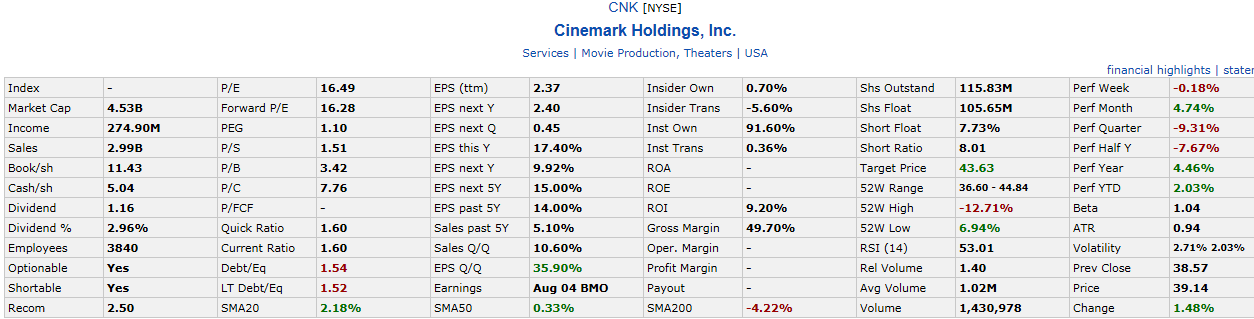
Chart courtesy of finviz.com
Short pros: Very high debt burden; insiders are selling.
Short cons: High dividend yield; low short float.
There is a mixed data amid clear chart structure. The risk on the trade should be limited by all means to avoid excessive loss.
Chart 6. Callon Petroleum Company (NYSE:CPE) Monthly: Trend Based Sell Setup
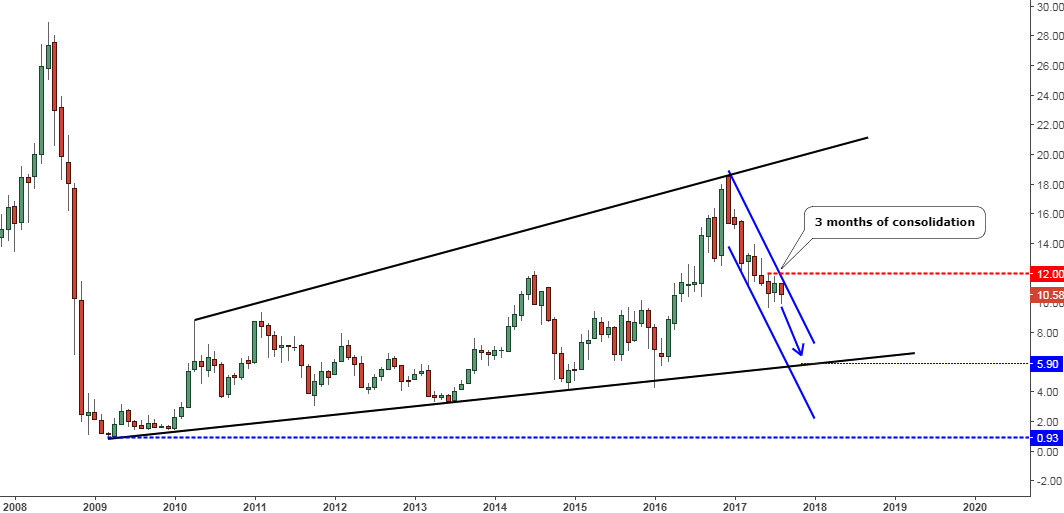
Chart courtesy of tradingview.com
The last chart belongs to the Callon Petroleum Company (NYSE:CPE). The price is moving within an eight-year long consolidation (black diverging trendlines). Before that, the company lost almost all of its value amid the collapse of energy markets.
This is not the perfect setup for those who seek peak/bottom trading. But it has an excellent risk/reward ratio. The blue downtrend shows the path for the current drop. The price spent the last three months in a small consolidation where the range was set by the June candle’s extremes between the $9.63 low and $12.00 high. Therefore the risk could be limited above the $12 mark, which is very close to the Friday’s close ($10.58).
The minimum target is located at the $5.90 mark on the trendline support. If the price should crack it, then we could see further weakness down to the major low at the $0.93 mark. Therefore, this setup has an excellent risk/reward ratio.
Company’s fundamentals are below.
Table 7. CPE Financial Highlights
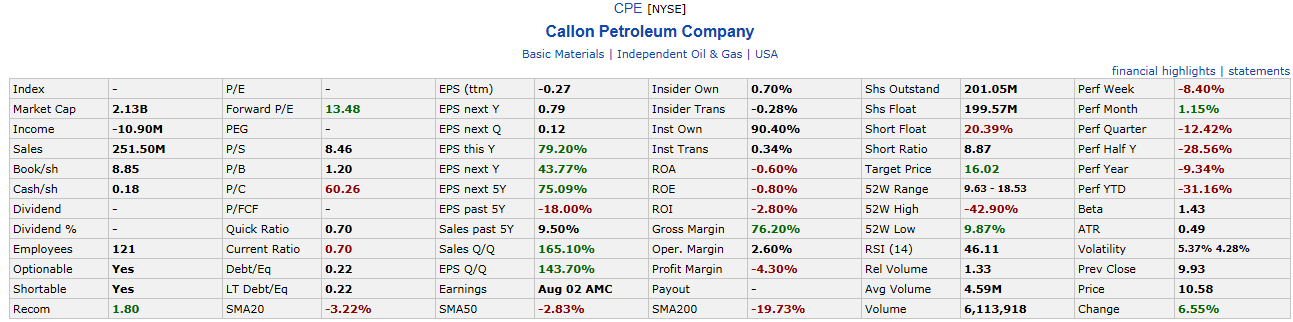
Chart courtesy of finviz.com
Short pros: Negative performance; high price ratios; big short float; the company makes losses.
Short cons: Low debt burden, low P/B ratio.
The most important values support a short, and it’s not a surprise as the price is already in the middle of a huge drop.
Please take a moment to comment below to share your opinion on these stocks.
Intelligent trades!
Aibek Burabayev
INO.com Contributor, Metals
Disclosure: This contributor has no positions in any stocks mentioned in this article. This article is the opinion of the contributor themselves. The above is a matter of opinion provided for general information purposes only and is not intended as investment advice. This contributor is not receiving compensation (other than from INO.com) for their opinion.