

In the previous Gold & Silver update I warned you about the possible correction ahead. Indeed, both top metals showed weakness, but I didn’t think it would be that severe as we quickly reached seemingly distant supports both in gold and silver. Later I shared with you my concerns about golds outlook as the Fed starts cutting its massive balance sheet this month. This could be a real game changer as market wizards call for another perfect storm for the financial markets. In the charts below I try to model this change for you.
I would like to start with the U.S. 10-year Treasury notes (UST) chart as this instrument has a strong relationship with gold, which I already showed you in August.
Chart 1. U.S. 10-year Treasury Notes Daily: Bear Flag Works Out
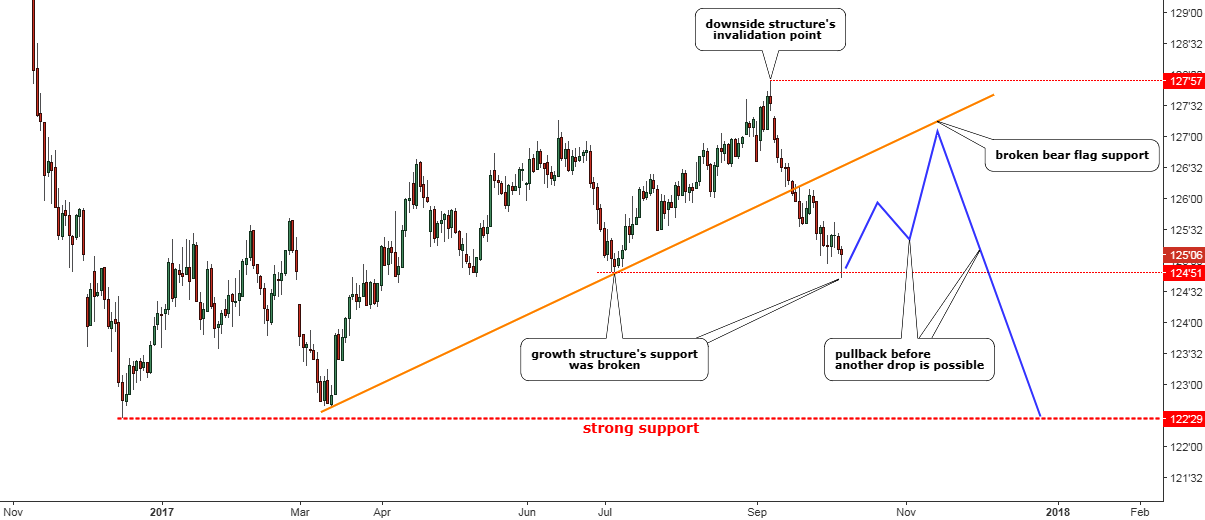
Chart courtesy of tradingview.com
Above is an updated and zoomed in chart from my last post. I chose a daily time frame to focus on the tactical move to see how the chart structure of the instrument develops over the time.
I spotted the Bear Flag pattern on the monthly chart almost two weeks ago. And now on the daily chart above, you could see that the pattern works out as the price dropped below the orange support and even hit the previous low at $124’51 mark. It is a good sign for bears as an important initial point of the previous growth structure was triggered. The market closed higher bouncing off that support.
So, the current focus for the price is limited with triggered support on the downside ($124’51) and the new invalidation point on the upside set at the maximum point within the Bear Flag at the $127’57 mark. I added the blue zigzag to show you the possible price action we could face ahead. It implies the possible pullback to the broken flag’s support before drop resumption.
Based on the downside scenario in the UST market, I modeled the gold chart below.
Chart 2. Gold Weekly: Triangle Is Possible
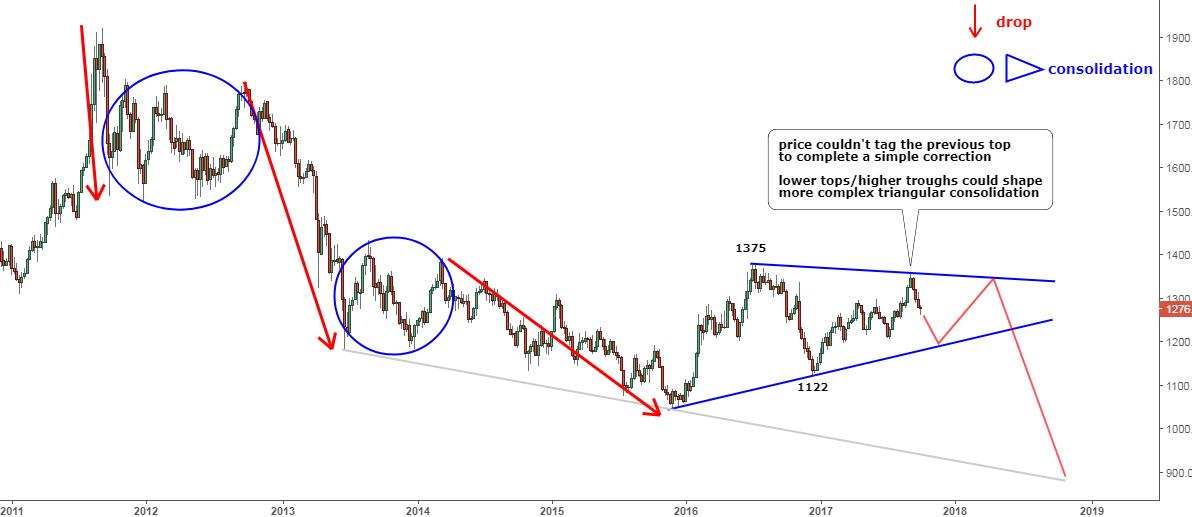
Chart courtesy of tradingview.com
I put this weekly chart above to let you see the forest for the trees. I highlighted the whole downside move from the all-time high in 2011 until now.
Every drop (red arrow) was followed by a time-consuming consolidation (blue). After the first drop (3 weeks) the consolidation took 53 weeks to complete, after the second drop (38 weeks), it took the same period of 38 weeks. The last drop from $1392 to $1046 was the longest – 89 weeks. But the current sideways price action already took even more – 96 weeks, and it is yet to be completed. If you looked to the left at 2013, you would understand that nothing has changed from that time as the price is still within that range. Long-term investors, though have to be patient.
Let’s get back to our current chart structure. The earlier upside move couldn’t tag the previous major top at the $1375 mark to complete the simple correction consisting of two upside legs as it was highlighted in July. Lower tops and higher troughs could shape more complex triangular consolidation (blue converging trendlines).
The red zigzag within the Triangle pattern shows the possible path for the price action. It implies a further drop to the downside of the pattern, then another test of the upside and then the final breakdown, which could hit $900 mark where the projection through the previous lows (light gray) appears.
I highlighted the important triggers for both upside ($1375) and downside ($1122) price actions. These triggers confirm invalidation of the triangular pattern. The drop below $1205 (previous low) would totally invalidate the growth structure within the simple correction highlighted in July.
Let’s see if the correlation of instruments would continue to fulfill the plan.
Intelligent trades!
Aibek Burabayev
INO.com Contributor, Metals
what about Jim Richards and his pres. trump dollar reboot where he predicts gold to go to 10,000/oz before year end?
Dear Aibek,
I think Gold wants to touch or test it's previous bottom of around 1060, however, more precised picture will found after second weak of October, and there will be a fragile situation after November 2nd weak on wards.At present, $ 1315 and $ 1345 will be big hurdles, and $ 1255 can be consider as a crucial support, breaking after that, movement will become more sharp and faster.