Back in May, I posted the alert about the upcoming rally of the index in case of the breakup of the triangular consolidation. Indeed, the S&P 500 already booked more than a 100 points gain from that day ($2679) but what I see in the chart now is not inspiring me these days.
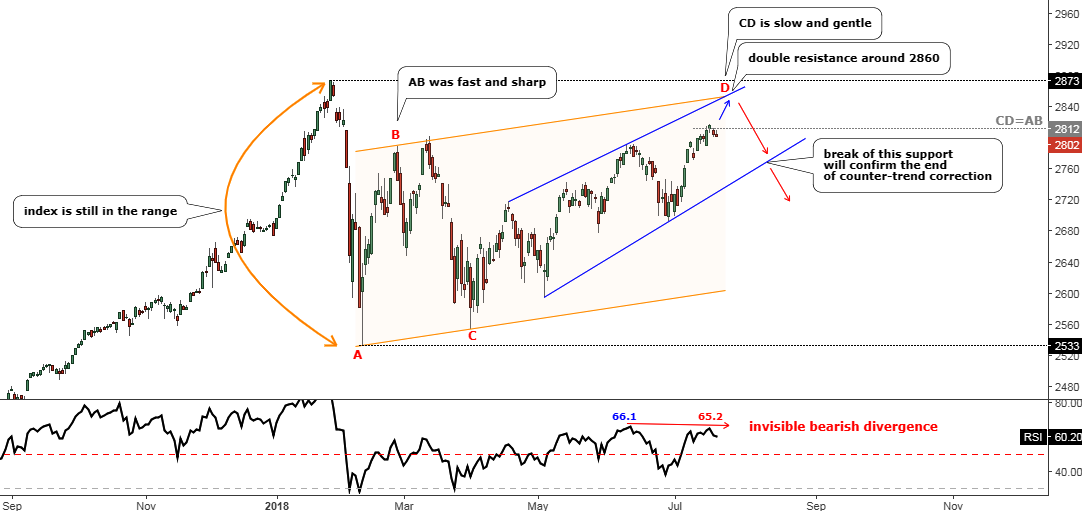
Below is the new daily chart where I made the annotations to express my concerns.
S&P 500 Daily Chart: The Index Loses Steam Within A Possible Large Complex Correction

Chart courtesy of tradingview.com
First of all, let me tell you why I gave the title “Not A Rocket” to this post. Usually, a good rally has a sharp angle of the trend, and anyone could easily identify it with the naked eye. This is what I was looking forward to giving the title for the earlier post using the proverbial phrase “Fasten Your Seatbelts.”
The initial move after the post was full of hope as we quickly overcame the $2700 handle and hit the $2742 high by the middle of May. Then there was a setback to the threshold area at the $2677, which looked dangerous at the end.
The next month of June there was a weird inverted U-shaped roller-coaster type move, which erased all gains of the index to the $2791 by the end of the month closing at the $2718. This was the first sign that the market is not as strong as we believed as investors started to book the profit in the area of former tops established in February and March.
The current month brought relief to the bulls as the market broke above all earlier tops except the major one at the $2873. In spite of it, I think we could see another significant drop later on.
I split the move up from the February low at the $2533, which is contoured with the orange uptrend, into two segments. The AB segment was fast and sharp as it has an angle of 80⁰ degrees and it took only 18 days to emerge. The latest CD segment, on the contrary, is slow as it lasted for more than three months already and it has a gentle slope of only 40⁰ degrees. These two indicators made me think that we could be trapped within the long lasting massive, complex correction. I warned about the possibility of such a scenario in my February post.
The RSI indicator also hints at the upcoming weakness of the S&P 500 as it has invisible Bearish Divergence on its chart as the new top has a lower reading of 65.2 compared to the higher reading of earlier top of 66.1 despite that in the price chart there is a higher peak.
Cautious traders could book a profit this week as the gain is always better, especially when it’s thick, besides the CD segment is already equal to the AB segment at the $2812. Now, the price is in a minor consolidation, and another spike higher is possible to touch the area of $2860 where both orange and blue resistances intersect. $13 above, there is a powerful resistance of the major top established in January at the $2873.
If one would like to keep long so far, then he should observe the blue support. Once it gets broken it would be better to catapult out of this crashing plane as the range of correction between the $2533 and the $2873 is too broad to survive it.
Again, as I wrote in my February post, there are no signs of the global market reversal yet and after this consolidation completes there could be another round of growth ahead.
Intelligent trades!
Aibek Burabayev
INO.com Contributor, Metals
Disclosure: This contributor has no positions in any stocks mentioned in this article. This article is the opinion of the contributor themselves. The above is a matter of opinion provided for general information purposes only and is not intended as investment advice. This contributor is not receiving compensation (other than from INO.com) for their opinion.

the correction will be at least 1 month later than you above show.
Regards,
Pavel Furch