
Last month the crude oil futures hit the target much earlier than it was planned. When the target was reached, I started to think of a reversal to come as the overall structure of the chart implies it. This thought was based on the deep retracement of the price, the overall completion of the pullback, which hit the broken resistance, and not in the last place due to the 100% progress of the CD segment (CD=AB). I shared it with you along with the crucial downside triggers in the weekly chart of my earlier post.
Let’s see how you felt the market those days in the last ballot’s results below.
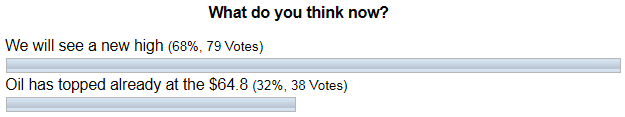
You are just amazingly accurate in predicting the future! Again, the majority of you were absolutely right as crude oil futures established a new high of $66.60 beating the earlier top of $64.8 for almost two dollars. I am very grateful to all of you who read my posts here at INO.com and support my chart experiments with likes and votes.
Let’s move on as the weekly chart below shows that not only the new high was established.
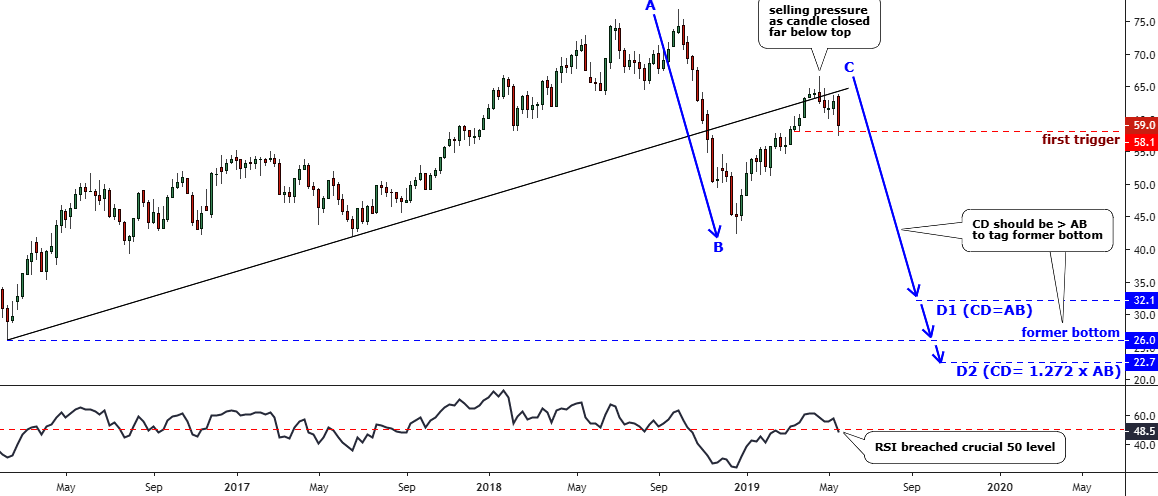
Chart courtesy of tradingview.com
I would like to start from the flashy sign on the chart, the top of a pullback, which has a weird weekly candlestick. Despite that, the price could establish a new high of $66.6; the very same candle closed far below that top at the $62.8 or almost $4 down. This shaped the red bearish body of the candlestick and the long wick on the upside. Such a situation reflects a high selling pressure that appeared at those levels.
Earlier in my life, I got an experience of trading crude for an oil producer, and that is why I understand why sellers were nimble to lock in the thick margin at such a high price. I guess they hedged the largest portion of upcoming production to extend the period when they need to raise less funding to carry on their business. Short sellers should be there as well as the cooling global economy amid bitter trade wars can’t afford to pay that high price.
There is a crucial observation that confirms the power of the trends. Four candlesticks in black trendline’s contact area at the pullback’s climax closed within the narrow range of $62.8-$64 just around the axis of the trendline at the $63. It offered a resistance, strong enough to reverse the price down.
Crude oil futures pierced the first downside trigger at the $58.1 last Thursday. In the background, the RSI indicator breached below the crucial 50 level and turned bearish. So I prepared the new plan for the downside game with annotations for you.
As always the second leg of the move is easier to tailor as we already have clues from the first one, and we can make the required measurements. The CD segment, which starts from the recent top of $66.6, could reach three target levels. The notch at the $32.1 was marked as D1 where CD=AB segment. It is not enough to tag the second target at the former bottom of $26 as there is a room of $6.1 left. The third target was calculated as usually with the next Fibonacci ratio of 1.272, and it is located at the $22.7 (D2). This would be more than enough to tag the multi-decade trough.
The first invalidation trigger of this bearish plan is located above the top of the recent correction beyond $63.8.
To judge if these targets are conservative or too optimistic, let’s look at the last monthly chart below, which gives a bird’s eye view.
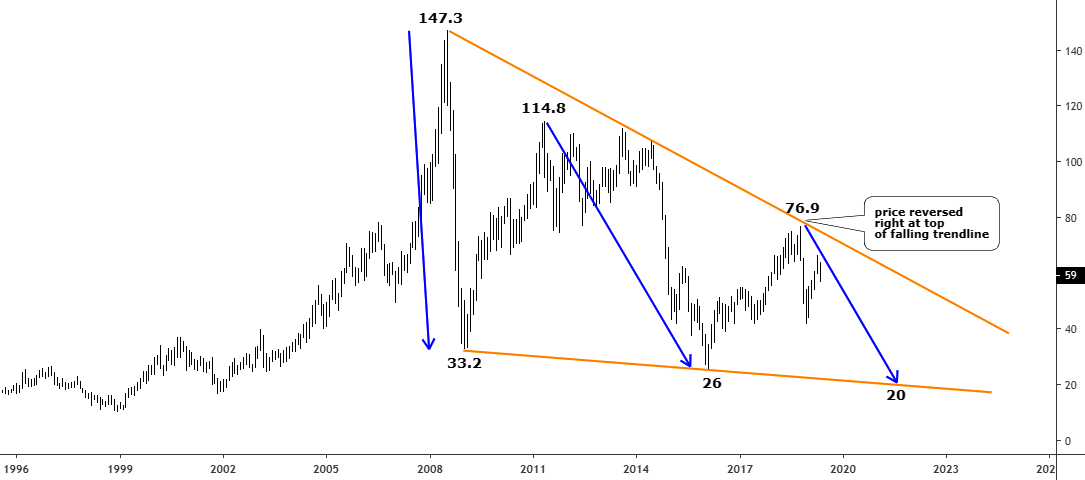
Chart courtesy of tradingview.com
Look at this monthly chart above, how volatile is the price of crude oil! The range of the moves is just astonishing.
It looks like we got three significant moves down within a giant orange Falling Wedge. The first move had a terrifying vertical trend with almost right angle as the price dropped like a rock. The second move had a less sharp angle with a large consolidation inside.
We are in the third and possibly the last move down. Its apex was established right at the topside of the Wedge as we again witness the power of the trends. I built it with the angle, which is sharper than the second move as the intermediate pullback was way shorter. The third down arrow points at the $20 area, which confirms that the D2 target in the previous chart is not overly optimistic.
Intelligent trades!
Aibek Burabayev
INO.com Contributor, Metals
Disclosure: This contributor has no positions in any stocks mentioned in this article. This article is the opinion of the contributor themselves. The above is a matter of opinion provided for general information purposes only and is not intended as investment advice. This contributor is not receiving compensation (other than from INO.com) for their opinion.
What I see in the final chart is the Federal Reserve. The '08 peak resulted from Bernanke slashing rates and from Quantitative Easing. The '14 peak that fell off a cliff came from Janet Yellen ending QE. '18 peak resulted from the Tr*mp effect of spiking deficits and weakening dollar, then cratered with FR rate hikes. Now we're in a range waiting to see what Powell does, if he cuts rates or not, or restarts QE. Dollar strength is a factor in oil prices.
Hi Jim , It is great , everybody has their own good theory and opinion of why things happen .
Your theory is as good as any on OIL .
We live in interesting times , Never thought we would see planes into buildings , A African American president Obama . Almost the first female president . Trumps election win , and continued troubles unending with trumps presidency . The world with so much trouble threats all over , A Trade War what is next , surprise me .
Oil they said in some book peak oil Oil is running out , I just don't know , unsure on electric cars etc , they need lots of KWH of electricity and still need fuel or oil too generate power for these cars etc .
Will we see $200 - $300 a barrel of oil one day .?
OPEC, Russia, and XOM all want $100 oil, at least, and that is their goal and reason for supporting Tr*mp against the possibility of fiscal responsibility and a return to a late '90s powerhouse greenback. A recession, of course, can see a return to $35, but it will be brief, followed by huge stimulus and rate cuts and spiking oil. We're in a range now waiting to see what the FR will do.
I will look for a bottom in the 32-33 range. This will make the last leg (wave e) of the triangle equal to 50% of wave c and within the final wave e, wave (c) will equal wave (a). It will be at this point that everyone will be bearish looking for a test of the previous low at 27.56 and waiting for at least a test before covering shorts. This could happen by early 2020.
Third attempt to breach the upper trendline is approaching and will result in a breach...with a projected target of $185/BO. This is consistent with the fundamentals (peak oil and/or the approaching war in the Middle East)...which will ultimately prevail.
@ Mark Rohrlach: A Target of $10 USD per barrel??? Fall 2021. Once the reality of an economic recession in China can no longer be denied.
Hi Tom . It is most likely the world will be in recession by then 2021 . The funny thing is that I thought we would have been in constant recession since 2008 . I never seen all the money printing or creation , this saved the world temporarily . If they keep printing money forever their will be no big recession .
I have always had trouble predicting a time exactly spot on accurate like 10 o'clock tomorrow etc or next month .
Time is hard thing too get right . I find the trend predictions I get mostly right but always way out with my timing prediction .
You maybe right with your 2021 Fall Oil bottom , but it is way out their still . That is after the US elections .
How are the economics of oil at $10? At that level, the trade will be on the futures market, where every commodity is just another speculative (gambling) vehicle. The real market, where the commodity exists, will be between producers and first consumers and it probably won't be in dollars or bitcoin. If this doesn't happen, there won't be any oil available because no producer can make a profit at that price. Middle East producers won't accept dollars either.
Hi Carl I don't make the rules , I only predict and see things don,t add up ever .
If you believe what you think , than oil should not have sold off from $147 per barrel to $27 etc .
How do you explain this .
Crude Oil comment .
Yes oil below $20 USD my target is $ 10 USD at the bottom .
The secret of why these markets move is only understandable if you scrap the fundamental approach of supply and demand .
These trends work on a different reason . The fact is their is a wave count that markets have to follow , A LAW .
No cheating . Back in 1999 , the old end of the world , OIL was $10 USD a barrel . This will be the support for this bottom .
Back in 2016 Brent oil was trading at $27.88 USD a barrel
Oils high $74.57 USD a barrel 2019 /4 was the end of this wave up I believe .
Oils trend down is going to be unbelievable reaching $10 USD a barrel .
How long it will take too get their is the question .
Oil was $147.40 2008 top Brent . Target $10 USD a barrel but when ?.
Dear Mark,
Your study is quite applicable and me too, awaiting for such ultimate bottom. it is hard for us to convey such type of prediction because people at large just consider this as "Un belivable" target of around $ 10, however, quite possible to find such levels.
Your last two words "But when? " is significant because it takes too long time to achieve certain final bottom-outs.