
Gold has missed our main target by $20 as it topped at the $1557 on the 4th of September. The gold optimists still benefited nicely as this peak was $67 above the first target of $1490, that we hit more than one month ago. So, it was definitely worth it to keep bullish for one more month.
Let’s see below if there were a lot of gold optimists a month ago.
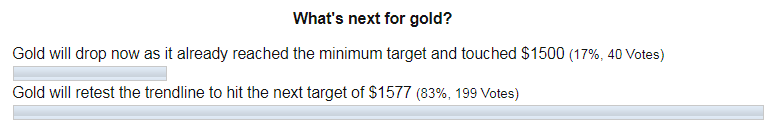
Indeed, the majority with a large margin preferred the continuation of the gold’s rally. It means you could book more than $60 for every ounce staying bullish. Thank you for support as I also believed in that outcome.
In the meantime, we should bear in mind that this was just a considerable correction, which had started in December of 2015. It has been retracing the other drop between 2011 and 2015. So, it is evident that the considerable drop and the correction are almost equal in time it took to emerge – 4 years both. Shall we book the recent rally as “done”?
After many years on the market, I stopped worrying about guessing the top or bottom of the price. Yes, we could miss it as the price extremes are the emotional spikes, and it is hard to guess when it stops. But we could detect the reversal as we have a particular approach for that.
Let’s look at the daily chart below to see if there are any signs of reversal as price is below the multi-year top.

Gold has dropped right after it hit the multi-year top and the move was quite strong and worrisome for bulls as day after day it was falling lower and lower until it reached the area of orange trendline support, which been built through the valleys established in May and August would be the first bearish trigger for the gold once the trendline gets broken. On the other hand, if the price will reverse here and move up beyond the former top, then this low at the $1485 level could become another growth point as it was in August when the price started to elevate from the $1400.
From the structural point of view, there are two distinct moves have appeared – the first one is the drop, which potentially could become an initial move down within the upcoming huge collapse. The second move is the pullback, which has retraced the first move for more than a half, and that is enough to continue further down.
The RSI showed its Bear Face earlier last Monday as it had sunk below crucial 50 level for the first time since May when this whole second leg up had started. This adds to the Bearish Karma for the gold.
One could have spotted the bearish pattern on the lower time frame as I did for you below in the 4-hour chart.
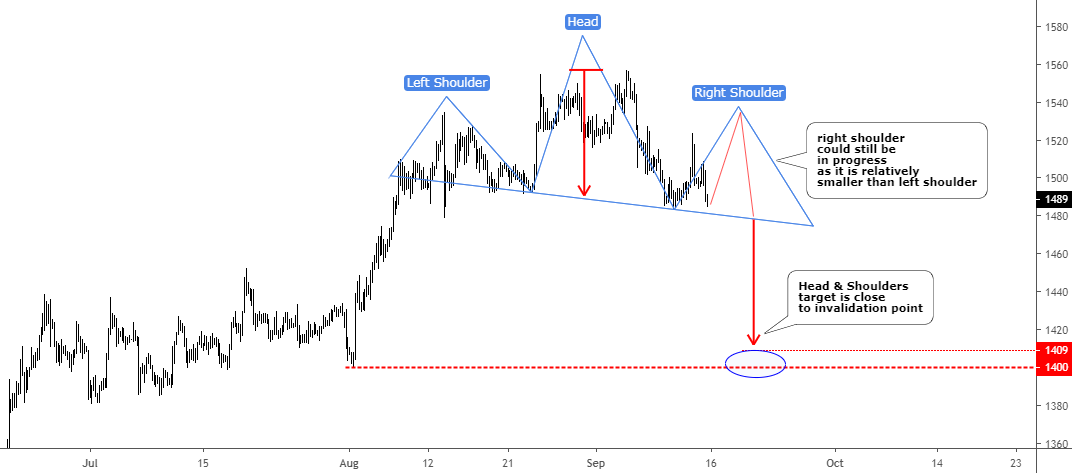
Chart courtesy of tradingview.com
Most of you know this pattern very well. The combination of the higher top between lower highs shapes the reversal Head & Shoulders pattern (blue). The right shoulder could still be in progress as it is relatively smaller than the left shoulder. The latter took 15 days to unfold and the right shoulder just a newborn as it has been emerging for only 3 days. Therefore, we could see another spike higher as the second leg of a pullback in the area of the left shoulder’s top ($1535) before further drop appears (red zigzag).
The pattern is declining as the left Neckline point is higher than that one on the right. It amplifies the bearish outlook. The breakdown of the Neckline below $1478 will validate the pattern.
The target is located at the distance of the Head’s height ($69) subtracted from the breakdown point ($1478) at the $1409. This target is very close to the invalidation point, and this drop could trigger it.
So, the bulls could capitulate if the price will not recover above $1557 again.
Intelligent trades!
Aibek Burabayev
INO.com Contributor, Metals
Disclosure: This contributor has no positions in any stocks mentioned in this article. This article is the opinion of the contributor themselves. The above is a matter of opinion provided for general information purposes only and is not intended as investment advice. This contributor is not receiving compensation (other than from INO.com) for their opinion.
As the gold price is now $1,516 and that is above the $1,489 (potential 3rd touch and bounce up) it seems those who voted NO to "Do you think the gold price has topped already?" have won.
Lower interest rates = weaker dollar = higher gold. But where are rates going?
A brief glance at the charts of various dollar indexes (DXY, trade-weighted dollar index) shows that gold has rallied despite a strong US dollar. This mainly shows that one should never make assumptions about the persistence of well-worn inter-market correlations. These things do occasionally change. Regarding interest rates: gold has recently mimicked moves in nominal rates, but it is actually real rather than nominal interest rates that matter for gold prices (the best market-based proxy for real rates are TIPS yields). One must keep this in mind, because a time may come when real rates stay negative despite an increase in nominal rates - this happened e.g. in the 1970s, when gold was often positively correlated with nominal rates (but continued to be negatively correlated with real rates).
The fact that gold has already broken out to new highs in all other major currencies suggests to me that it's merely consolidating now in USD before continuing its move higher. A similar pattern occurred during the last bull run between 2000 and 2011. Gold's run in USD isn't over, IMO. People far smarter than me, especially those who look at gold's momentum profile and not merely its USD price (e.g. Michael Oliver @MSA) feel similarly.
lets remember that these prices are for paper gold not bullion.
Just wait till the DOJ complete their investigation on gold manipulation and it becomes public knowledge.. Paper gold prices will collapse and then the price of gold will reflect the actual amount of bullion available. 'Think I'm wrong???
Bill
Yes, you are wrong. There is no difference between the "paper" gold price and the bullion price... you can check bullion prices at refineries and compare them to futures contract prices for confirmation.
Moreover, the manipulation issue involves so-called order spoofing - which is by no means unique to the gold market, it happens everywhere. It also has no effect whatsoever on the overarching price trend - the effect is strictly short term and very small.
the trend is up almost worldwide. I hope that the RSI this time does not work.
please pardon my ignorance. what is or does RSI mean?
Dear Bill, it's ok. We all have something to learn every day.
Here is a link about this indicator below.
https://www.babypips.com/learn/forex/relative-strength-index
Relative Strength Index, or RSI, is a popular indicator developed by a technical analyst named J. Welles Wilder, that help traders evaluate the strength of the current market. RSI identifies overbought and oversold conditions in the market.
In my charts we watch 50 levels as crucial point between bullish and bearish condition of the market. We could trace that on the daily chart above where the RSI indicator kept above this 50 level all the time during the recent rise of the gold price. Since it broke below ahead of price breaking the trendline there is a risk that the breakdown would follow.
I hope this one will help.
Best wishes, Aibek
Thanks Aibek
Sounds like a full time job!
I'll watch the results
Bill