Back in March, I shared with you an updated chart for palladium. It hit the record high of $1553 by that time to become the most precious metal, and it still is.
Every time the price makes a record high, there is a chance for a reversal. In that post, I measured the AB/CD segments of the upside moves on the chart and both short term and long term measurements showed the equality, which meant the possible exhaustion of a Bull Run. I didn't try to guess the top that time and asked your opinion. Below is the distribution of your votes.

Most voters chose the $1600-2000 range for the top of the palladium price, which meant that the established new record should be updated to the upside. Your prediction amazingly came true, but this bet wasn't that obvious as it played out only five months later, when the metal refreshed the all-time high at $1601 in July as only then the price entered the forecasted range. Last week the price did it once again to hit a new record high of $1750, confirming your accurate prophecy. Congratulations!
Let's see what happens with the palladium futures these days in the weekly chart below.

Chart courtesy of tradingview.com
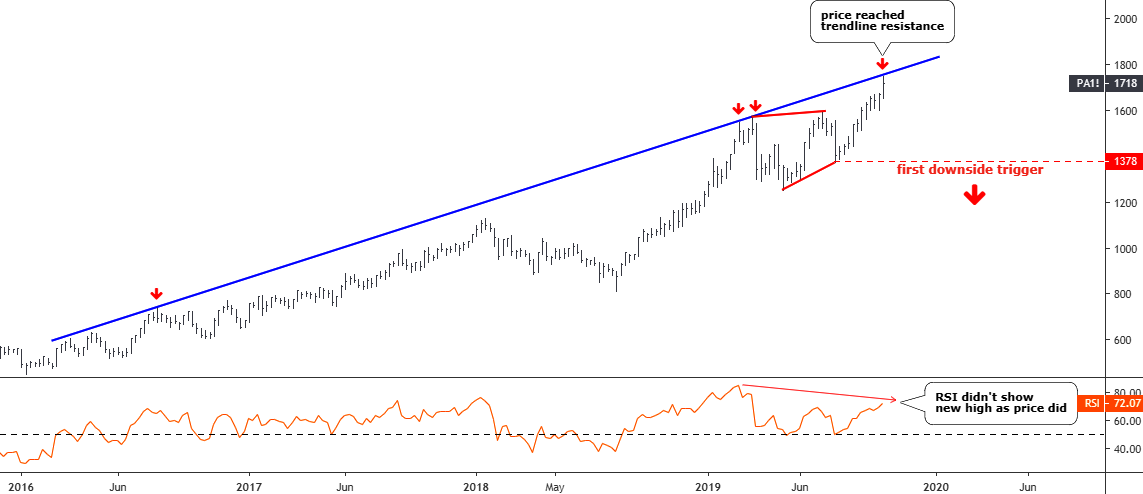
After my previous post, where I thought about the completeness of the move up, the price first briefly printed a new high of $1577, and then it sharply dropped to the downside as price lost hefty $320 or 20%. That collapse coincided with the return of gasoline futures back above $2 as it had put the pressure on the demand for big engine cars and hence for palladium. The metal's weakness was short-lived as it attracted buyers, so the price quickly rebounded to reach an even higher level of $1601. Then, the following drop completed the two-leg consolidation (red trendlines) with a valley of $1378. After that, another rally had started as usual following the consolidation phase.
On the chart above, we can see that price not only established a new all-time high at $1750 but also reached the blue trendline resistance. This is the fourth touch as it turned to be a very strong resistance now and the price could be rejected to the downside. Besides that, the RSI didn't follow the price to print the new high accumulating Bearish Divergence. Watch the bottom of the preceding consolidation at $1378 as the first trigger for the drop.
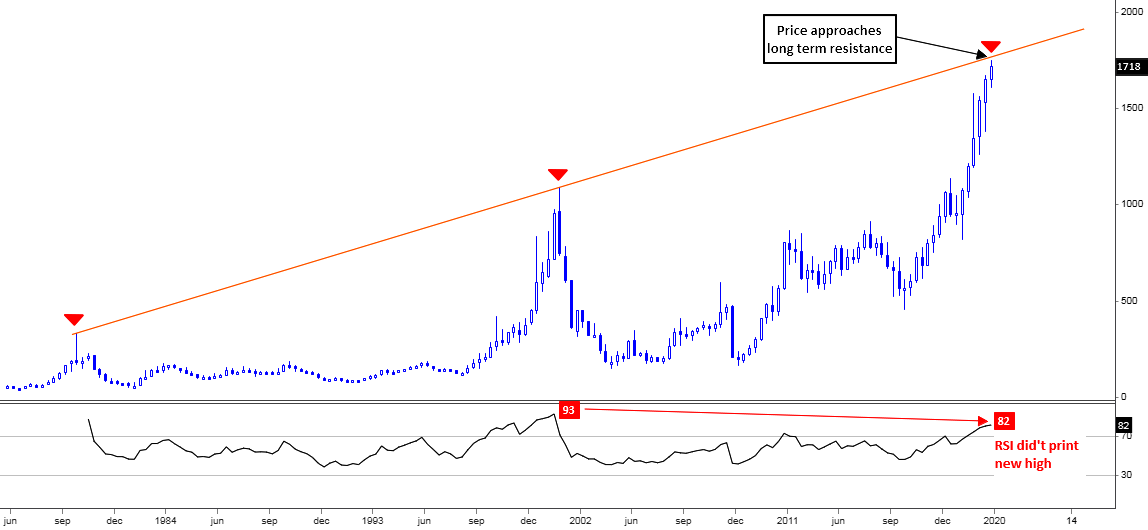
The title for this post is about Double Resistance, the first resistance was shown in the weekly chart above, so where is the second one? I switched to the quarterly time frame to highlight it for you below.
This is a very long term quarterly chart of palladium futures, which starts from the distant 1977. Here is our second trendline resistance highlighted with the orange color. The price approaches it as it is located at $1770 level. This will be the third touch as we can find the first one at $332 in 1980 and the second is at $1090 in 2001. Will it reject the price again as it did before? We are yet to see it.
Every time the futures price was rejected, it shaped the "mountain peak" as the price dropped to the bottom of it. It happened in 1982 and 2003. This time it could reach the foot of the "mountain" at $452, where it started back in 2016. It implies the huge loss of $1266 or 74% for palladium from the Friday close. Both past peaks look symmetric, and it means that the time it could take to reach the foot is equal to the time the price spent to rise to the top. The present peak has been shaped for 45 months so that the descent could be completed in July of 2023 then.
According to the projection of Johnson Matthey Public Limited Company in 2019, there will be a net deficit of the metal in the amount of 25.2 tons. Almost the same deficit of 27.3 tons was recorded in 2017 when the price of the metal has gained huge $455. This year it has done even more as the palladium price grew by $560. So, the price has already gained enough in comparison with the past period to cover the deficit.
Intelligent trades!
Aibek Burabayev
INO.com Contributor, Metals
Disclosure: This contributor has no positions in any stocks mentioned in this article. This article is the opinion of the contributor themselves. The above is a matter of opinion provided for general information purposes only and is not intended as investment advice. This contributor is not receiving compensation (other than from INO.com) for their opinion.

