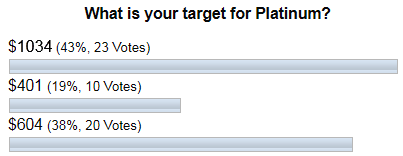
Last time I updated the platinum chart in March was when "Palladium Pushed Platinum To A Record Low" within the ratio mostly due to the strength of palladium. Platinum has hovered around $900 for three years now as it was lost and forgotten after the “execration” of diesel engines. This "fallen angel" had been shaping a sideways consolidation this past spring, and I had thought it could repeat 2018’s drop following the same structure. The targets were set at the $640 and $401 on the downside, and the invalidation point was assigned to $1034.
Let's see below how you voted for the future of platinum.
Most of you picked the $1034 option, which implied the breakout of the consolidation in the upside direction towards the invalidation area. This was the closest call as the majority voted for a bullish move, which, indeed, had happened as platinum couldn't break below the consolidation valley of $788 and bounced up to reach the $1000 level this past September. That price hasn't been seen since February 2018. Again, this was your amazingly accurate prediction, not only for that period but also for a longer-term outlook as I spotted it in the big chart below.
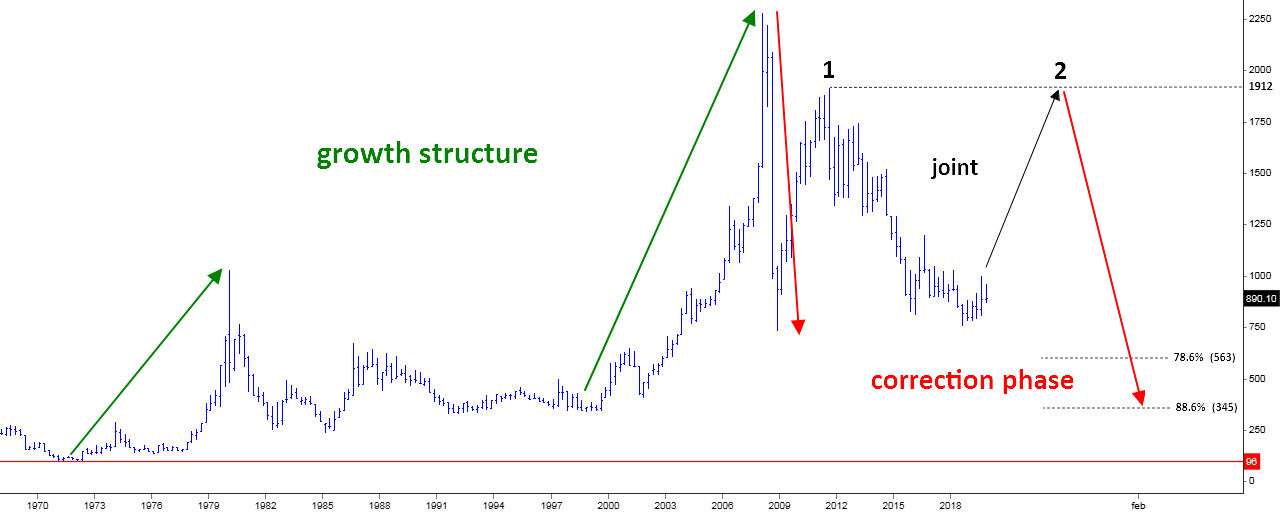
Chart 1. Platinum Futures Quarterly: ↗$1912 ↘$345
This is a very long-term quarterly chart above. It started from the ’70s when the price of platinum was just below $100, and nobody could imagine then that only in a decade, it would rise ten times to hit $1000 per troy ounce. I marked that move with a green up arrow as it has been just a first growth segment. It was followed by a very long consolidation, which took more than eighteen years to unfold from 1980 until the end of 1998.
The right green up arrow highlights the second move up. The price increased seven-fold from $334 to the historical maximum at $2309 within ten years. It was a culmination of the large growth structure, which had been unfolded for almost four decades.
The continuation of this story you know very well as The Great Recession didn’t spare any metal including platinum. The price dropped like a rock, and within three quarters, it reached $762, losing 67% from the all-time high of $2309 by the last quarter of 2008. I marked it with the left red down arrow as the first move down within a big corrective structure, which is yet to be completed.
The following bounce back up was almost as sharp as the previous drop, but it had run out of fuel ahead of the all-time peak, and it stalled at the $1918 mark. I marked it with a black “1” digit as it is the first move within a counter-trend correction (joint). It had already been fully retraced last summer as the price fell to $756 level then.
Now, there is the most intriguing part, where we will go next? I think we will see another move up (black up arrow) to retest the apex of the former move up inside of the “joint” at $1912. It’s a huge move up as this “rocket” should overcome more than $1000 distance from the current level. I am puzzled with the question - what kind of event should happen to push the price so high? The diesel “anathema” is still there, and the “Green Movement” is only gaining momentum. I would highly appreciate if you share your thoughts in the comments section below about the possible reasons for that kind of move. It could be something terrible, kind of “Black Swan” event.
The chart’s story doesn’t end with that move to the upside as we also have the right down red arrow there, which highlights the pending second move down to complete the entire correction phase or at least the very first part of it within the more complex correction. It is yet early to make the final calculation of that drop thought, and I put the start of it from the former top of $1912 as I assume the second leg of the “joint” would stop there to make a perfect “box.” This preliminary setup shows that drop could reach the $345 target where the 88.6% Fibonacci retracement level is located.
Intelligent trades!
Aibek Burabayev
INO.com Contributor
Disclosure: This contributor has no positions in any stocks mentioned in this article. This article is the opinion of the contributor themselves. The above is a matter of opinion provided for general information purposes only and is not intended as investment advice. This contributor is not receiving compensation (other than from INO.com) for their opinion.


As to what could happen - a major supply disruption would be a possibility. Although the South African platinum industry has just managed to bed down a wage agreement with surprisingly little friction, the fact remains that SA's most militant mine-workers union represents most PGM miners these days. Labor strife is very common in the industry and an extended strike will probably happen again at some point. Another driver (from the demand side) could be increased substitution of Pd with Pt, to the extent that it is possible. Generally it seems to me that the supply/demand balance of all PGMs is quite precarious in the long term (i.e., it seems likely that the entire group of metals will see demand outstrip supply. Currently it is the turn of palladium and rhodium, but it is not too difficult to imagine that platinum could be next).
Speaking of rhodium, given what is known about industry inventories and the upcoming bump to demand from tighter pollution regulations in China, I would not be terribly surprised if rhodium went back to $10,000 per ounce or even higher. Rhodium is particularly effective in controlling nitrogen oxide exhaust emissions and there is in fact no substitute for it at present. Unfortunately there is no futures contract for rhodium, and it is difficult for retail investors to buy it (a few avenues do exist). Northam Platinum has just bought an ore body neighboring one of its mines that is reportedly extremely rhodium-rich, so that may offer an opportunity to participate in a rhodium boom indirectly.
Dear Mr.Tenebrarum, thank you very much for sharing an extended insight with all of us here.
I looked into possible opportunities of trading rhodium - there is the Xtrackers Physical Rhodium ETC. It is a UCITS eligible, Exchange Traded Commodity incorporated in Jersey. The ETC is 100% backed by physical rhodium and is designed to track the USD spot price less fees. Other rhodium exposure ie derivatives etc is not allowed. It is traded on London Stock Exchange in USD. Market cap is USD 66.85 million.
Regarding Northam Platinum (NHM), it has gone so far to the upside. Here is the link to the chart https://www.tradingview.com/x/QALS9kNI/ that I tailored especially for our readers. It shows the comparison of the stock with the champion Palladium. The main chart structure matches accurately. It looks like the latter is the driver for this stock. So, beware of imminent correction of palladium price. The NHM stock price is already in the 2nd leg up, which touched the common 1.272 ratio level. I put the blue target box there as it can reach even higher up to 1.618 above SR 13000. But be careful as all minimum targets are reached both in palladium and NHM.
Best, Aibek
thanks for sharing interesting info
Dear Peter, thank you for a warm feedback. Best regards, Aibek