
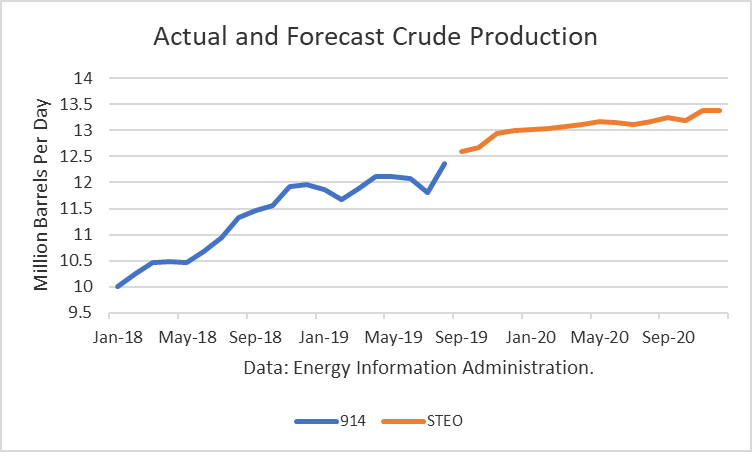
The Energy Information Administration reported that August crude oil production averaged 12.365 million barrels per day (mmbd), up 599,000 b/d from July. The gain was primarily due to the fact that July production had dropped due to Tropical Storm Barry, which shut-in 9.2 million barrels, or 297,000 b/d for the month, based on real-time estimates. In addition, July production was revised downward by 40,000 b/d. Nevertheless, the net increase of around 250,000 b/d from the adjusted July figure was a large increase and confirms the EIA’s weekly estimates for the month.
Production in the Gulf of Mexico reached a new high at 2.006 mmbd. The previous record was 1.979 mmbd in April. Texas production also reached a new high of 5.121 mmbd, up 98,000 b/d from July. Other gains were 43,000 b/d in New Mexico, 28,000 b/d in North Dakota, 15,000 b/d in Louisiana and 12,000 b/d in Colorado. Alaska was down 66,000 b/d for seasonal reasons, and that production is likely to return.
Plains All American Pipeline LP’s (PAA) Cactus ll pipeline was expected to ship 300,000 b/d in August and to be at full capacity, 670,000 b/d, in September. EPIC Midstream’s crude oil pipeline began shipping 400,000 b/d. It is designed to ship 440,000 b/d from the Permian and another 150,000 b/d from the Eagle Ford.
Phillips 66 Partner’s Gray Oak pipeline is expected to ship an additional 900,000 b/d. It is scheduled to being shipments by year-end.
The effect of the pipeline additions will narrow the spread between Midland and the U.S. gulf prices, effectively lowering breakeven costs in the Permian.
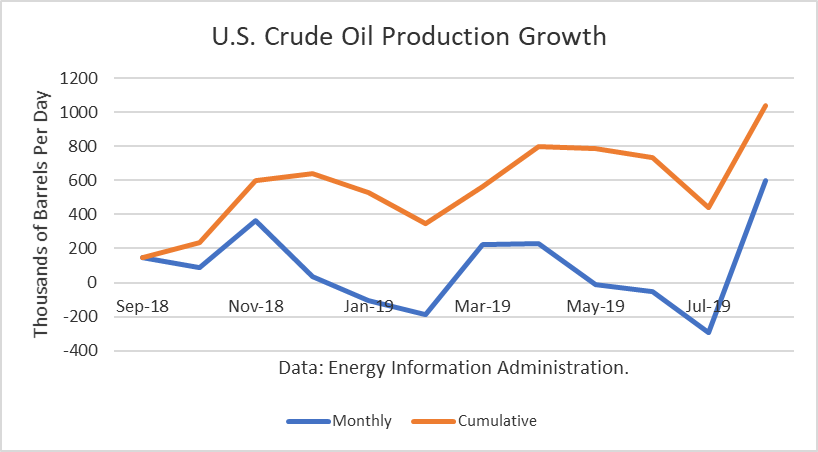
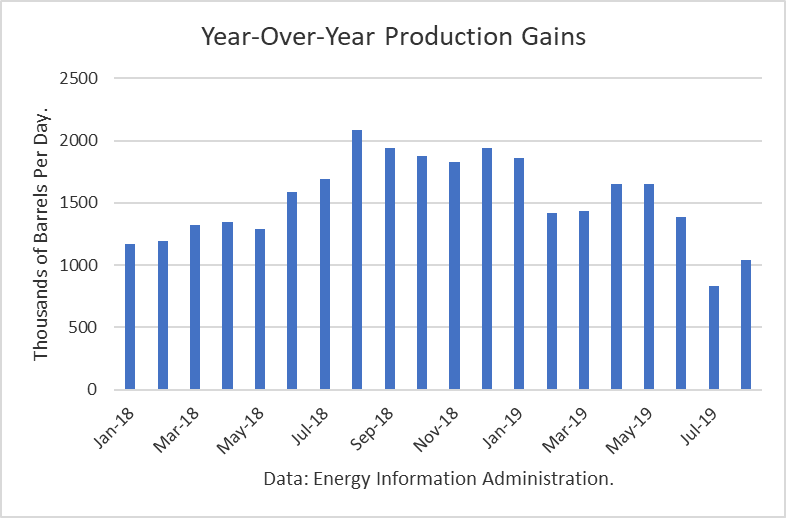
The gains from last September have amounted to 1.040 mmbd. And this number only includes crude oil. Other supplies (liquids) that are part of the petroleum supply add to that. For August, that additional gain is about 140,000 b/d.
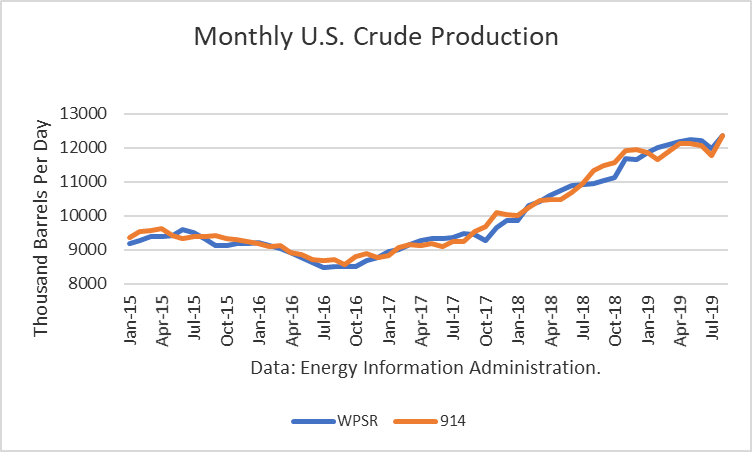
The EIA-914 Petroleum Supply Monthly (PSM) figure was 6,000 b/d lower than the weekly data reported by EIA in the Weekly Petroleum Supply Report (WPSR), averaged over the month, of 12.371 mmbd.
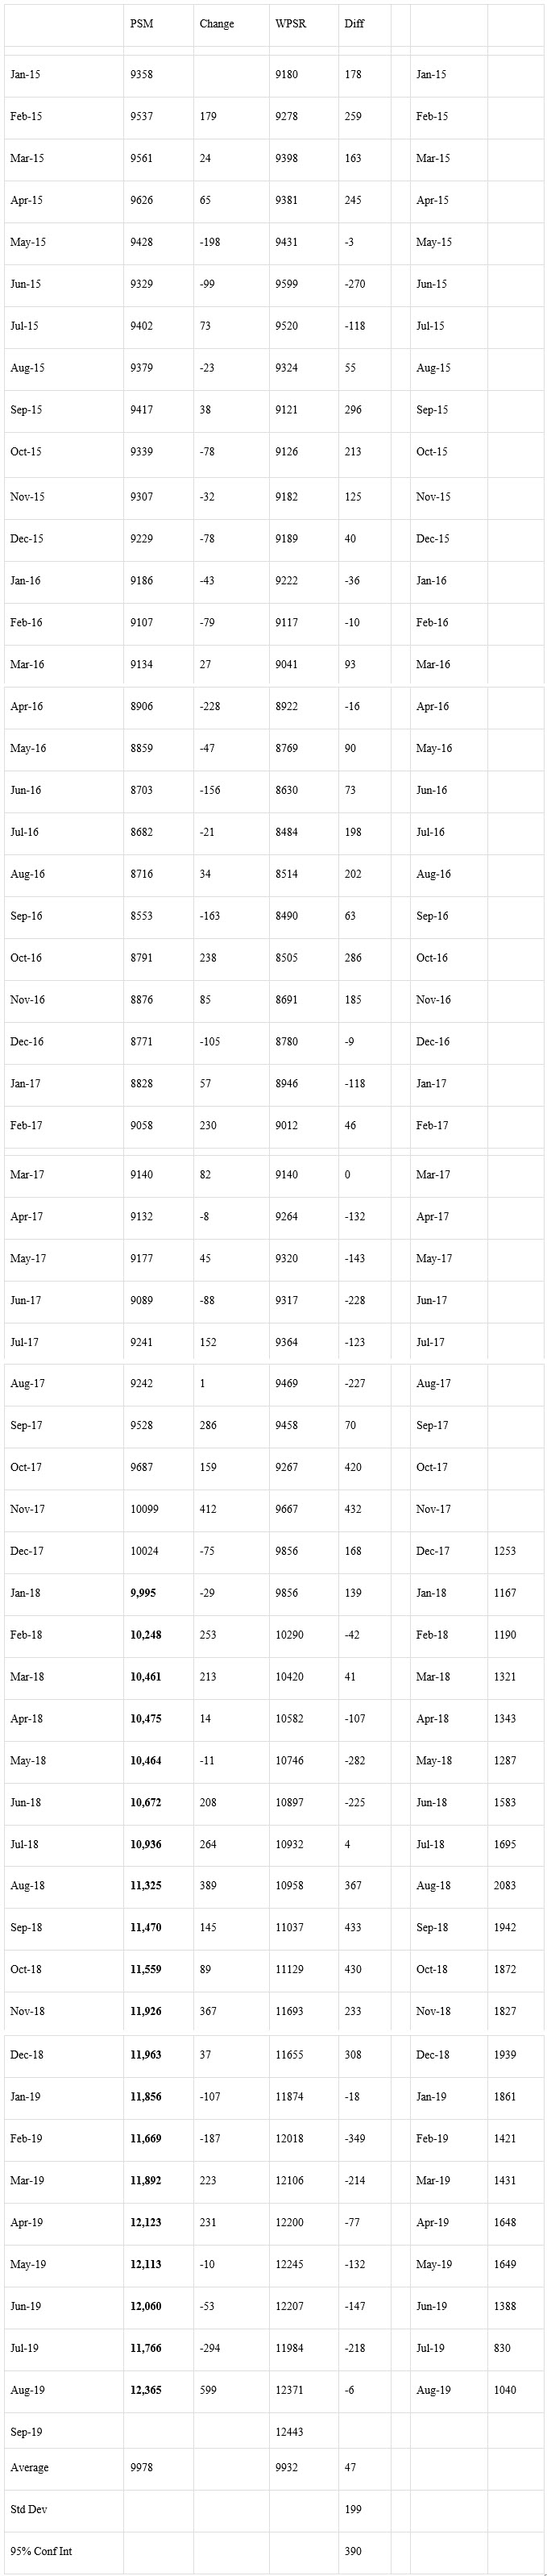
The July figure was about 12,000 b/d higher than 12.353 mmbd estimates for that month in the October Short-Term Outlook. That implies no need for another upward “rebenchmarking” to EIA’s model in future production levels at this time since the difference was not large enough to warrant it.
The EIA is projecting that 2019 production will exit the year at 13.0 mmbd. For 2020, the EIA is projecting an exit at 13.4 mmbd.
Conclusions
The rebound in GOM crude production reached a record high, and Texas also was a record. The seasonal drop in Alaska masked total U.S. production. I am expecting the new pipeline takeaway capacity to push Permian production much higher in the final months of 2019 and into 2020.
Check back to see my next post!
Best,
Robert Boslego
INO.com Contributor - Energies
Disclosure: This contributor does not own any stocks mentioned in this article. This article is the opinion of the contributor themselves. The above is a matter of opinion provided for general information purposes only and is not intended as investment advice. This contributor is not receiving compensation (other than from INO.com) for their opinion.
As I've understood it, Congress had rejected a bill to construct a pipeline through the plains to Canada, but the Trump administration had hinted an eagerness to proceed with the project. I'm not sure how far it's gone from there.
I had no idea that the US had controlling access to oil in those figures and was largely dependent on the middle easr.
What is happening or has been decided about the pipeline from Alaska through Canada to US?