
In February, I shared with you a "Buy Setup" for crude oil futures with a 1:6 risk/reward ratio. The trigger was set at $52.25, stop below $48.70, and the target was at $73.55. I always appreciate your kind support, as most of you liked that setup.
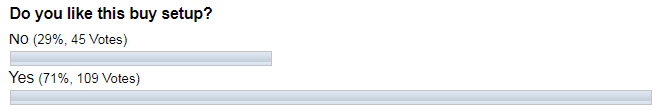
I also asked you if you thought that crude oil had bottomed?

The majority were sure that oil hadn't bottomed yet, and now we know that it was the best bet.
That setup was promising as it triggered the upside and booked almost 5% of the profit reaching $54.66, but then the price reversed down. It appeared to be the second leg of the counter-trend move within a consolidation. The downtrend resumed then, and setup failed in favor of the earlier idea.
That idea was posted last May as I asked if "You Were Waiting for Crude Oil at $20". I put the chart from that post below to refresh memories.
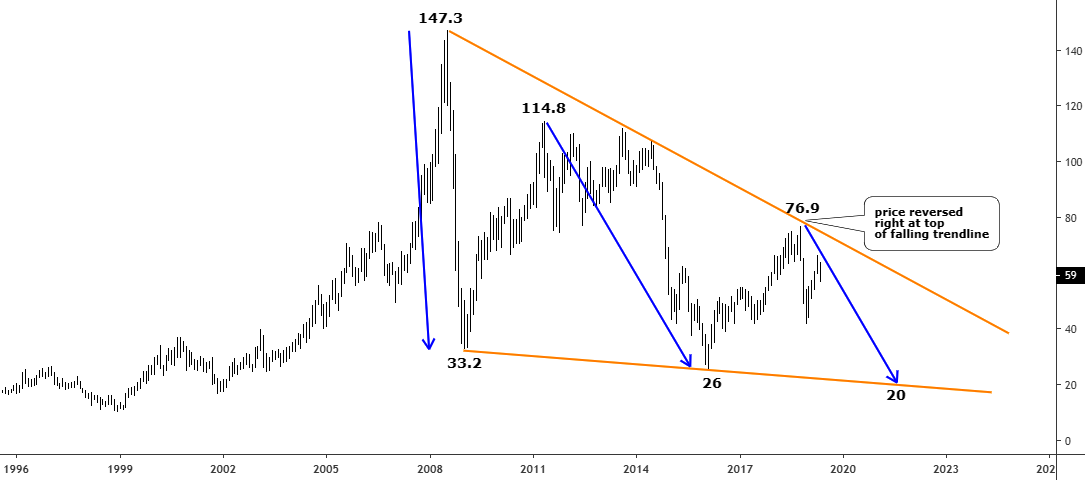
Chart courtesy of tradingview.com
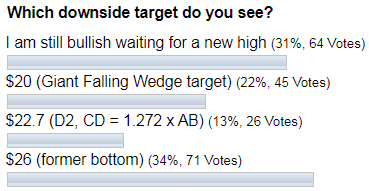
It was pretty daring to think about $20 oil price when it stood at $59 ten months ago. This chart was prophetic, and most of you (69%) appeared to be seers as you bet that oil will drop in the area between $20 and $26. It is incredible as the majority of you rarely, if ever, wrong. Below is the snapshot of your votes last year, my congratulations!
The most unrealistic target of $20 was reached as crude oil futures touched $19.27 last month. The virus and the price war between oil-rich Saudi Arabia and Russia did that job to bring the price so low. The giant "Falling Wedge" pattern showed it in distant 2018 when the price failed to advance beyond the resistance.
That's it? I don't think so. I agree with my respected fellow author Robert Boslego, who recently shared with you his opinion that the "Unprecedented Oil Glut Appears Inevitable". Let's see the monthly chart below, and I will share my view with you.
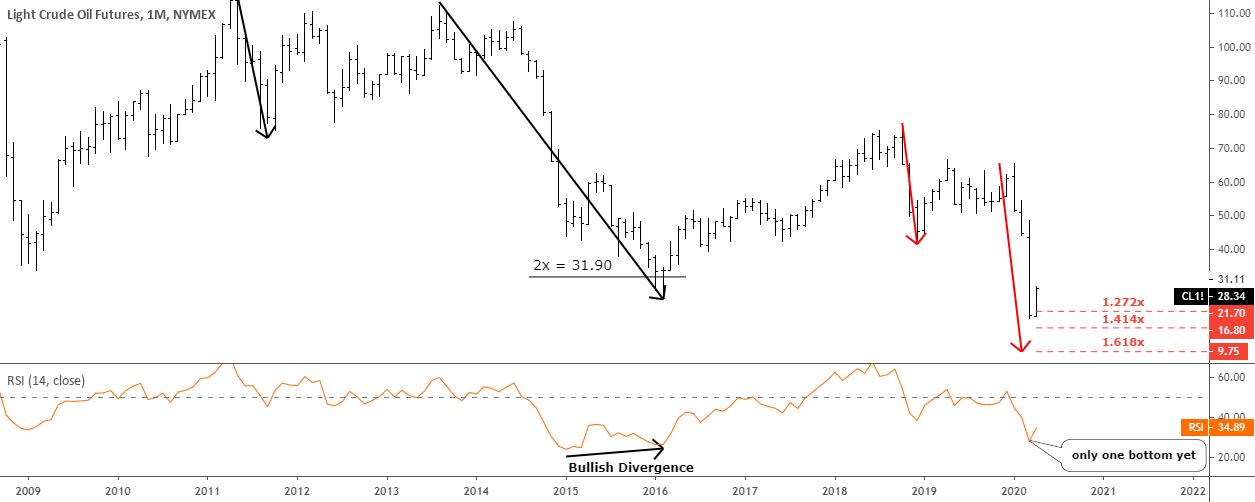
Chart courtesy of tradingview.com
We are in the second leg of the last significant move down. I marked it with two red down arrows. The other significant move also consisted of two smaller legs as I highlighted them with two black down arrows. The second leg of it unfolded at the double distance of the first one. Such a ratio is quite rare. Now let's look at the current move.
The equal distance of the first red down arrow was hit last month at $31.11, as well as the next 1.272x ratio at $21.70. Now we have 1.414x ($16.80) and 1.618x ($9.75) untouched. I checked the location of double distance and skipped it as it is a negative number.
So, the most common targets were hit already. Why do I think we can dip more? Let's look at the RSI sub-chart. The previous move had two valleys, and the second low was higher despite a lower price building a Bullish Divergence (black up arrow). The recent bottom of $19.27 is the only low so far, and I guess there should be another one higher to build another Bullish Divergence for reversal.
Sometimes the digit itself could be scary, and one should just see it in comparison to accept it. For that purpose, I took almost 50 years of oil price history to visualize its current position and targets on the quarterly chart below.
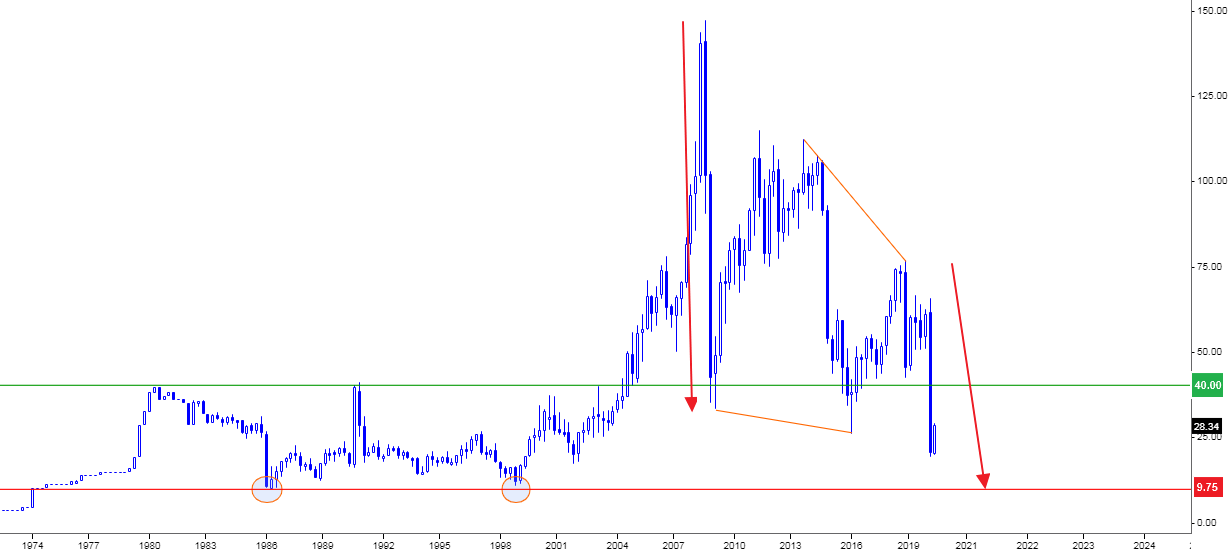
Chart courtesy of stooq.com
Now, it is much easier to see why the $10 price is possible. It was there in 1986 and 1998 as it was the bottom of the range. The upper side was located at $40, and it worked well as resistance until 2004 when it was broken up. That move was huge as by 2008, and crude oil peaked at $147, a fantastic level then and now.
A correction follows every strong move. This time it's huge and deep as it dropped below 61.8%, 78.6%, and even 88.6% Fibonacci retracement levels. This means that it aims to tag the former bottom at $9.75 to retrace the preceding up move fully. This level was already mentioned in the previous chart as the most optimistic target is there.
The entire correction consists of two legs down (two red down arrows). The last leg reached only 50% of the first leg. The next crucial ratio is 61.8% at $6.6, which is way below $10. Let's live and see.
Intelligent trades!
Aibek Burabayev
INO.com Contributor, Metals
Disclosure: This contributor has no positions in any stocks mentioned in this article. This article is the opinion of the contributor themselves. The above is a matter of opinion provided for general information purposes only and is not intended as investment advice. This contributor is not receiving compensation (other than from INO.com) for their opinion.
Recent movement found in Oil Trade indicates that basic inputs like currant and probable future Demand and Supply OPEC initiatives or Geopolitical factors, over and above all such things, Speculation will ply a vital role and will also shape a unexpected heavy volatility. Traders must beware of jig-show type and frequent either side movement. Probability of Single Digit Oil (Bellow $ 10) just can not be ruled out.
no comment