Both top metals couldn’t sustain the growth, although silver was more convincing than gold this time again.
Let’s start with the updated gold chart below.

Chart courtesy of tradingview.com
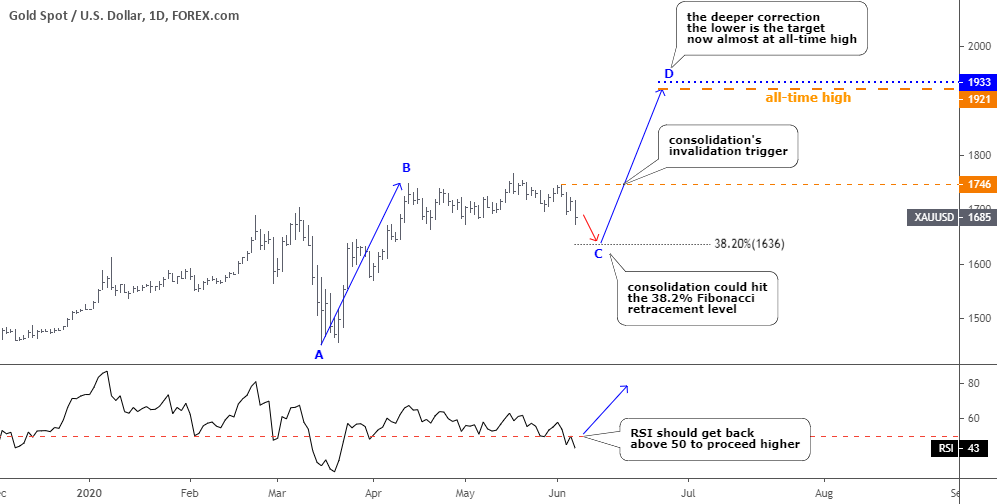
Gold is still consolidating as it couldn’t overcome not only the nearest peak of $1766 but it also failed right at the top of the AB segment of $1748. The RSI dipped into the bearish zone below the crucial 50 level. So, it’s the right time to put our classic instrument called Fibonacci retracement level as gold watches ground while both feet are in the air. The first important 38.2% Fibonacci retracement level could offer support at $1636.
Now we should adjust the aiming area of the CD segment as C point could start lower. Therefore the target should be moved lower as well. If we take the C point at 38.2% Fibonacci retracement level, then the D point could hit the $1933, which is shy away from the all-time high ($1921).
The RSI should get back above 50 to fuel the awaited rally. The price should overcome the earlier top of $1746, where the gold failed before to confirm the rally.
Now let’s see the updated silver chart, which is more interesting.

Chart courtesy of tradingview.com
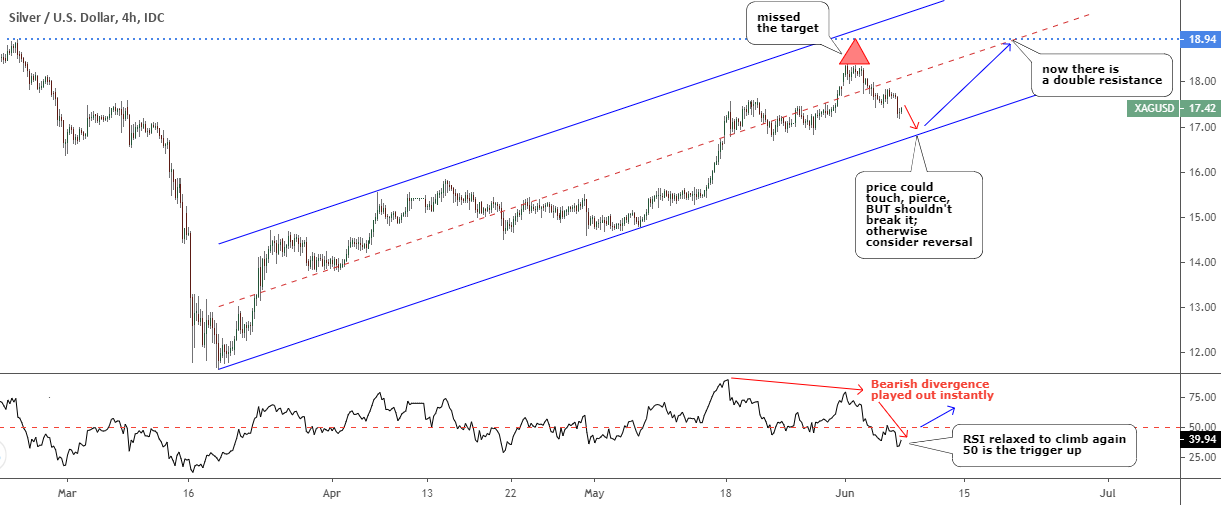
Silver stuck to the plan and rallied from $17.85 to $18.38 at the top, then it ran out of the gas on halfway and reversed missing the target by almost 60 cents. The drop is enormous as it reached $17.20 level last Friday, reversing all gains above former triangular consolidation and entering its territory deeply.
If you would look at the RSI sub-chart, you can see how Bearish divergence played out instantly after price reached a new high while RSI couldn’t. That divergence quickly sent the price to the downside even below the crucial 50 level. It is another evidence of the power of this simple indicator.
The question is this a total reversal, or it’s just a correction? At first glance, it might look like a complete reversal as price moved per plan and missed the target with a minor gap compared to the whole distance of the move, which started from $11.61. There are at least two factors against this idea. The first one is the integrity of the blue uptrend channel as it worked just perfectly so far, and it might save the price from the fallout. The second factor is the pending rally in the gold chart, which made a false start last week.
The price could touch or even briefly pierce the downside of the blue uptrend channel, but it shouldn’t break below it. Currently, the touchpoint is located at $16.70. This is deep enough to get rid of weak hands. Another rally could finally hit the preset target of $18.94, which is a double resistance now the former top and the mid-channel cross there. One thing that could be added here soon The relax of RSI during this correction could be deep enough to fuel an even stronger rally than we expected as the upside of the channel locates at $20.40 now.
Intelligent trades!
Aibek Burabayev
INO.com Contributor, Metals
Disclosure: This contributor has no positions in any stocks mentioned in this article. This article is the opinion of the contributor themselves. The above is a matter of opinion provided for general information purposes only and is not intended as investment advice. This contributor is not receiving compensation (other than from INO.com) for their opinion.
