Polls show that you were optimistic about the probability of another rally for top metals. Both of them go well with the maps that I shared earlier this month. Let's see, in the updated charts below if they are going to justify your bold expectations.
Gold is the first as it has a stronger position now.

Chart courtesy of tradingview.com
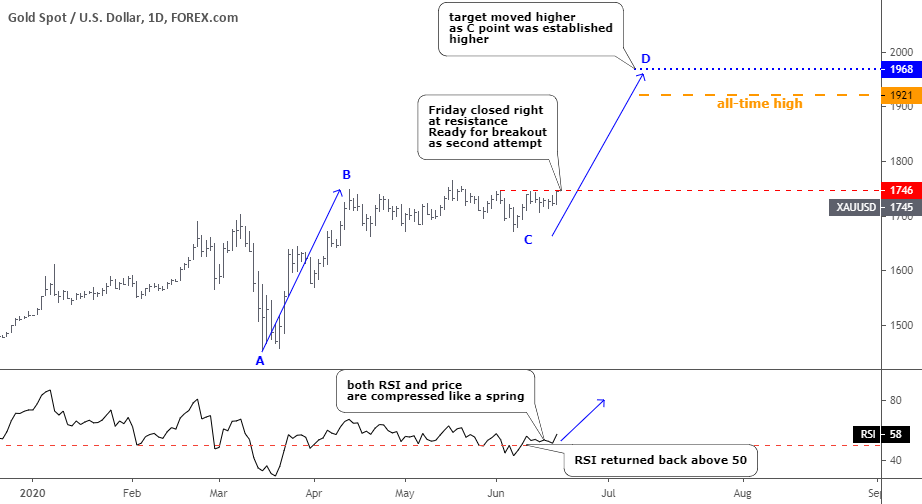
The top metal completed the sideways consolidation that I showed you two weeks ago. It didn't touch the 38.2% Fibonacci retracement level at $1636 as it stopped at $1671, which is even higher than the first leg of this corrective structure, which was established at $1661. It is an entirely natural outcome as the last leg down started at $1766, also higher than the top of the first leg did at $1748. The second leg down was longer ($95) than the first leg ($87).
I set the upside trigger at $1746 last time. On the 11th of June, gold almost kissed that level but failed to proceed. Now it's the second attempt. The RSI is back above the crucial 50 level. Both the price and the RSI were compressed within a minor consolidation and are ready to go higher. Gold is just waiting for the sound of the starting gun.
The target was relocated higher now as the C point was established at a higher level, either with a not so deep dive of the consolidation. The D point was set at the $1968, which is higher than the all-time high, but the former would offer a strong barrier anyway.
Let's check in on Silver.

Chart courtesy of tradingview.com
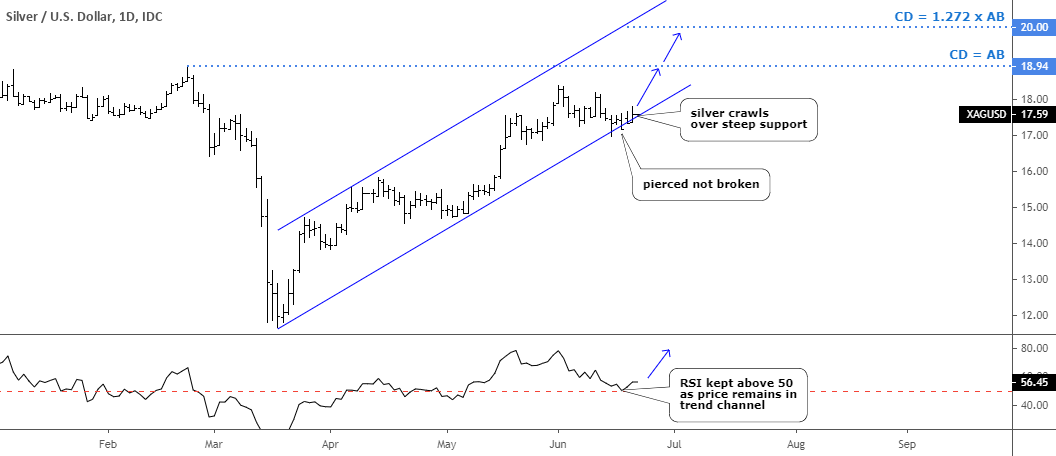
The consolidation on the silver chart was classic compared to the irregular structure of the gold chart above. Both legs are almost even here ($1.18 vs. $1.26), the slope is to the downside, beautiful.
Silver is "begging" the market for a second chance. Last time I warned you, that "The price could touch or even briefly pierce the downside of the blue uptrend channel, but it shouldn't break below it." This one came true as price indeed pierced the downside of the channel several times, but this "guy," he's not cut like that. The market pushed it back in the trend channel as silver was clinging to life.
Look at the RSI sub-chart below as this good indicator remained above the crucial 50 level, although it kissed the latter. This offered strong support for the crawling price.
This time I added the second target to the old one at $18.94. It is located at 1.272 of the distance of the first move up, which was finished on the 14th of April. The price should hit the round number level of $20 to reach that target.
Intelligent trades!
Aibek Burabayev
INO.com Contributor, Metals
Disclosure: This contributor has no positions in any stocks mentioned in this article. This article is the opinion of the contributor themselves. The above is a matter of opinion provided for general information purposes only and is not intended as investment advice. This contributor is not receiving compensation (other than from INO.com) for their opinion.

As a general remark aside from the technical picture: gold remains well supported by bullish macro-economic fundamentals, but faces headwinds from speculative positioning and sentiment. That said, one should not overweight the positioning and sentiment data while a strong uptrend is underway. The goal posts tend to move in trending markets, i.e., what represents a positioning extreme in an uptrend is different from a positioning extreme in a downtrend.
I BELIEVE GOLD AND SILVER WILL INCREASE IN VALUE BY AT LEAST ANOTHER 10% BY THE END OF 2020
Good point David. Gold may well get sucked down in a deflationary depression. In such a scenario though, where else would you want to be?
The broad true money supply (US) has just increased by 33% year-on-year, which is to say, there simply is no genuine "deflation". As to consumer prices, I am astonished that so many people keep insisting that gold needs a fast rising CPI to gain in value, when the last 20 years alone show this to be patently untrue. In fact, gold has historically performed much better in times of "price deflation" than in times of "price inflation". The reason for this is that price deflation tends to imperil the banking system, which in turn spurs monetary pumping by central banks. Gold outperformed in deflationary backdrops even before central banks were instituted, simply because people preferred to hold gold outside of the system in these situations rather than paper promises of any kind (such as banknotes).
Anyway, it seems rather glaringly obvious that gold has been strong for the past two decades amid a huge decline in government bond yields as fears of deflation have regularly flared up.
Watching Trump’s rally in Tulsa reminded me of the apocryphal quote from Mark Twain: “It ain’t what you don’t know that gets you into trouble, it’s what you know for sure that just ain’t so.”
What do we know for sure, that possibly, just ain’t so?
Investors should buy gold and silver as a hedge against inflation. Inflation that is sure to be caused by the Fed’s profligate increase in money supply, as taught by the Austrian School’s (Mises) theory on money supply and inflation. However, since the start of QE in 2008, the radical increase in the money supply has not caused inflation. Accordingly, many academics now believe that inflation depends on money growth AND THE VELOCITY OF MONEY. Prices increase when the product of the money supply and its velocity grows faster than real GDP. In the current pandemic, which could last as long as it takes to produce a vaccine, it is possible that consumer sentiment remains low and Americans continue to increase their savings; small companies don’t hire, and large corporations continue to hoard cash. In summary, in the absence of an increase in velocity, inflation could remain quiescent, with the price of gold vulnerable to declines in the SPX, as we saw in March.
Missing one point
the speculative fervour,the greed,the fear.
Your point as to velocity is excellent.