
Best Post Election and Inauguration Lift
The drumbeat of markets becoming more and more over-extended is becoming louder and louder. From the election to the inauguration, the S&P 500 is up 13%, which is the best for any president since 1952. Post-inauguration, all major indices as measured via the Russell 2000 (IWM), Dow Jones (DIA), S&P 500 (SPY), and the Nasdaq (QQQ) hit all-time highs. The broader markets have been propelled higher in an already frothy market as 2021 unfolds. All major markets have been in a raging, nearly uninterrupted bull market with the Nasdaq and S&P 500 up 100% and 75%, respectively, since the pandemic low.
These moves are a function of the vaccine rollout, continued stimulus coming out of Washington, massive fiscal and monetary accommodation from the Federal Reserve, the election cycle being capped off with the presidential inauguration, and new policies aimed at spurring economic growth. Despite these tailwinds, the markets are looking overextended, as assessed by a broad range of historical benchmarks and current indicators investors should heed in the near term.
Historical Measures and Current Indicators
A recent E-Trade survey showed that the majority of investors (91%) with $1 million or more in a brokerage account believe the stock market is in a bubble or close to being in one. From a historical standpoint, markets have exceeded levels reminiscent of the Roaring Twenties and are now approaching the dot-com bubble territory. These historical comparators of options put/call ratios, the broad participation of stocks exceeding their 200-day moving average, and P/E ratios may be potential warning signs of near-term pressures. Current indicators are also suggestive of frothy markets as measured by Bollinger bands and the Relative Strength Index (RSI).
Fundamentals – Lofty P/E Ratios
Price-to-earnings ratios are largely discordant with the economic backdrop and at historically lofty levels as measured by the Shiller PE. This indicator eliminates fluctuation caused by variation of profit margins during business cycles. Outside of the tech bubble in 1999/2000, the current Shiller P/E ratio of the S&P 500 composite is the highest on record, exceeding that of the Roaring Twenties (Figure 1).
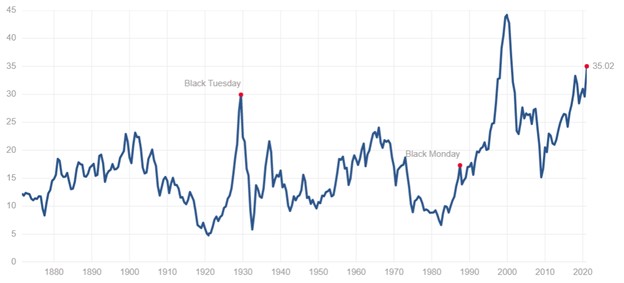
Figure 1 – S&P 500 Shiller P/E historical ratios over time
Put/Call Option Ratio
Options put/call ratio assess the volume of bearish put options relative to the volume of bullish call options. The ratio is at its lowest levels in 20 years, which may indicate irrational optimism by investors. The gauge can often be a contrarian signal for equity markets (Figure 2).
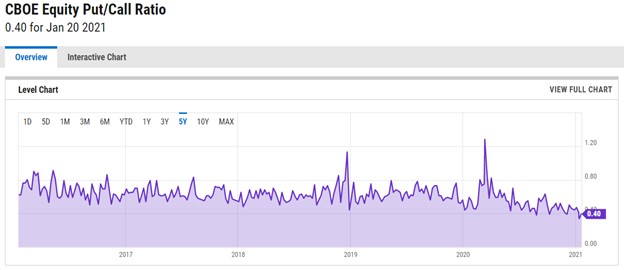
Figure 2 – 5 year put/call ratio data, registering the lowest mark over the past 20 years
All-Time Highs – 200-Day Moving Averages
The equity rally has been very broad, and nearly every stock in the S&P 500 is in a technical uptrend (e.g., stocks trading above their 200-day moving average). Roughly 90% of stocks in the S&P 500 are trading in this technical uptrend after the inauguration, which is the highest in years (Figure 3).
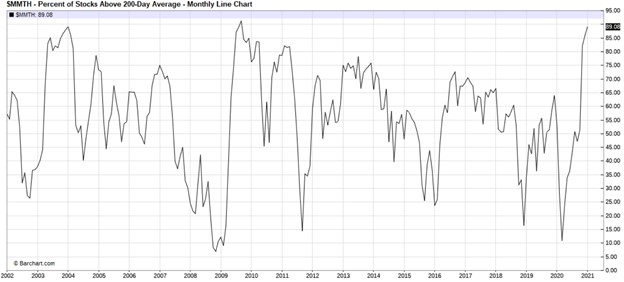
Figure 3 – S&P 500 technical trends, percentage of stocks above their 200-day moving average
Relative Strength and Bollinger Bands
Other technical indicators such as Relative Strength Index and Bollinger bands are also suggestive of markets that are overbought and pushing through two standard deviations from its 20-day moving average. The Russell 2000 index is an example of the RSI being chronically in overbought territory (reading > 70) and the upper Bollinger bands being nearly broken. These are indicative of a potential mean reversion of the underlying security (Figure 4).
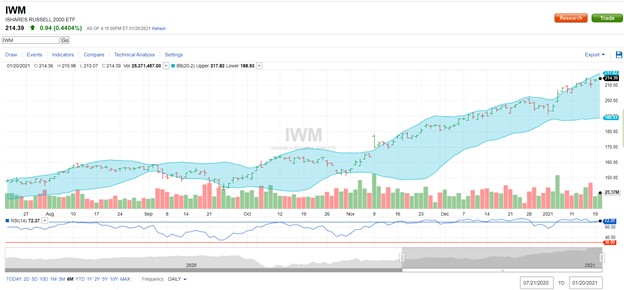
Figure 4 – Russell 2000 ETF breaking out of its upper Bollinger band and registering an RSI reading of overbought
Conclusion
From election to the inauguration, the S&P 500 is up 13%, which is the best for any president since at least 1952. Post-inauguration, all major indices as measured via the Russell 2000 (IWM), Dow Jones (DIA), S&P 500 (SPY), and the Nasdaq (QQQ) hit all-time highs. These moves are a function of the vaccine rollout, continued stimulus coming out of Washington, accommodation by the Federal Reserve, and the election cycle being capped off with the presidential inauguration. Despite these tailwinds, the markets look overextended as assessed by a broad range of historical benchmarks and current indicators that investors should heed in the near term.
Noah Kiedrowski
INO.com Contributor
Disclosure: The author holds shares in AAL, AAPL, AMC, AMZN, DIA, GOOGL, JPM, MSFT, QQQ, SPY, and USO. He may engage in options trading in any of the underlying securities. The author has no business relationship with any companies mentioned in this article. He is not a professional financial advisor or tax professional. This article reflects his own opinions. This article is not intended to be a recommendation to buy or sell any stock or ETF mentioned. Kiedrowski is an individual investor who analyzes investment strategies and disseminates analyses. Kiedrowski encourages all investors to conduct their own research and due diligence prior to investing. Please feel free to comment and provide feedback, the author values all responses. The author is the founder of www.stockoptionsdad.com where options are a bet on where stocks won’t go, not where they will. Where high probability options trading for consistent income and risk mitigation thrives in both bull and bear markets. For more engaging, short duration options based content, visit stockoptionsdad’s YouTube channel.
Thank you for taking the time. I am trying to spread to 4 different sectors of stock purchasing this year, as well as metals. I'm praying science and manufacturing will be strong this year.