The U.S. dollar index (DXY) did not make a significant pullback despite my expectations posted earlier this month. The minor bounce was short-lived as the price quickly reversed all gains and updated the low after that.
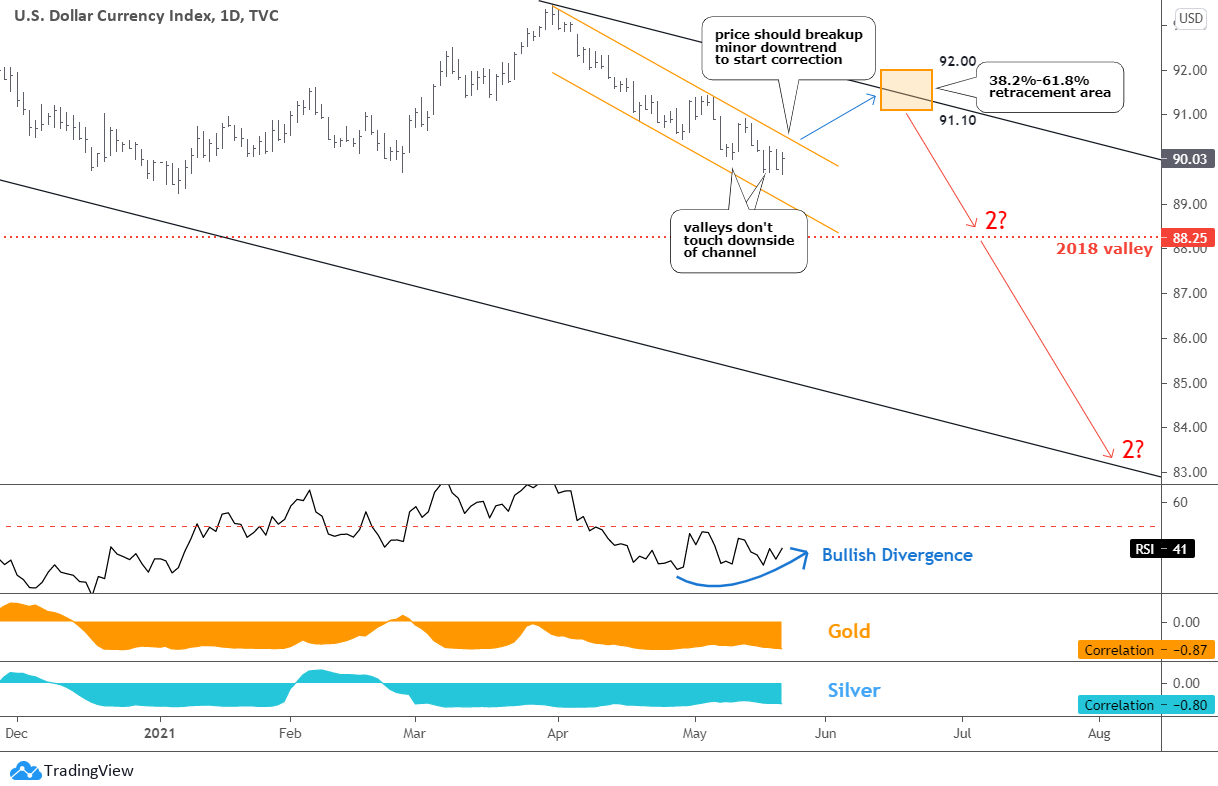
The downtrend is so strong that DXY could fit within a very narrow orange channel. However, I think we still need a visible correction to come, as new signals are alarming.
The primary alert comes from the RSI indicator as it shows a Bullish divergence with its higher lows contradicting with lower valleys in the price chart. There is another indirect sign in the price chart; the new valleys could not touch the downside of the orange channel amid the lack of enough bearish momentum.
The price should break up the orange downtrend to start the correction. The possible retracement area (orange rectangle) is between 91.10 and 92.00 (38.2%-61.8% Fibonacci retracement levels). It sits on the upside of the black downtrend.
This time I added the correlation ratios of DXY with gold and silver respectively to update the view. Both metals have a strong negative correlation, and gold has a higher negative reading compared to silver.
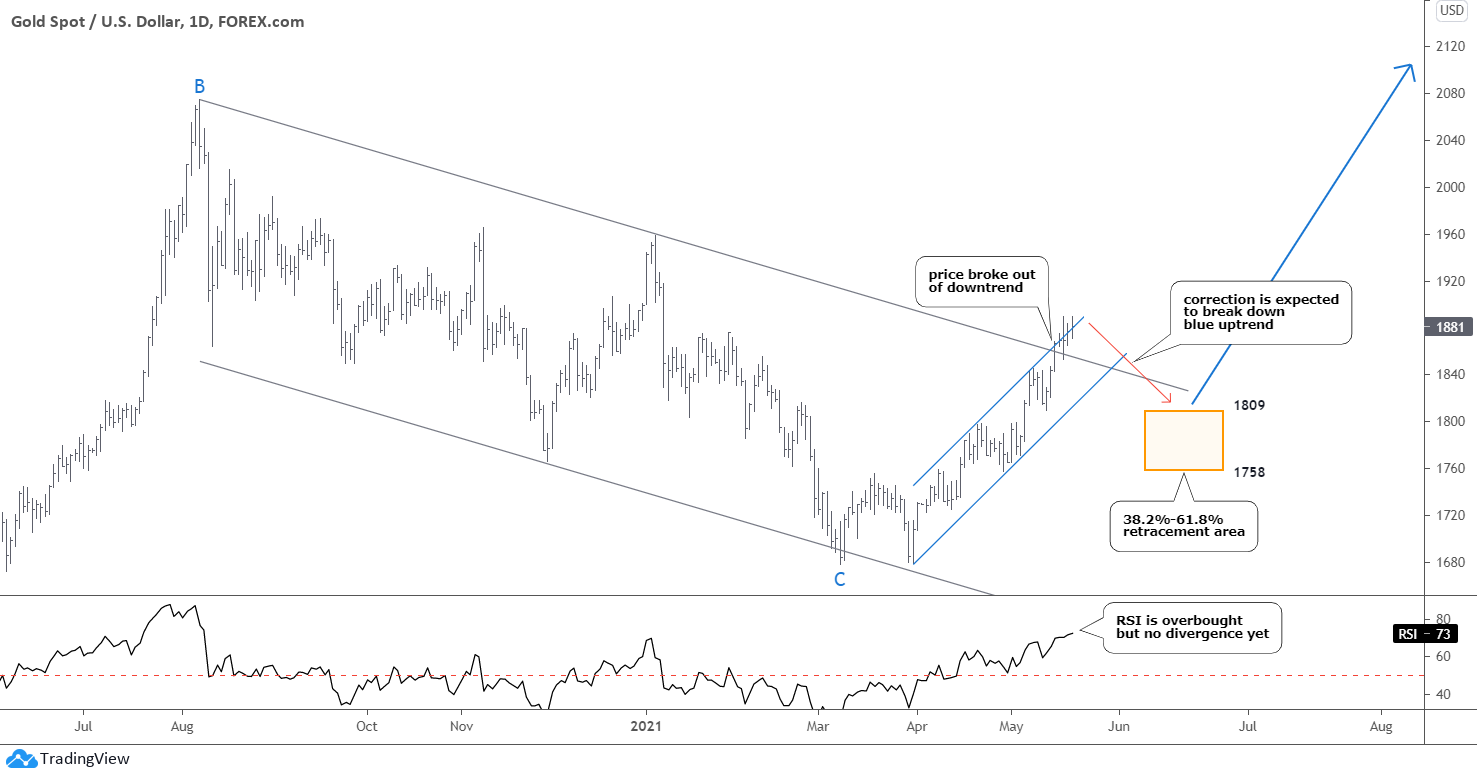
Gold finally managed to break out of the long-lasting downtrend (gray) that contoured the large complex correction (BC part).
There are no strong signs of upcoming correction in the chart. However, the firm opposite correlation with the dollar index and the highly overbought condition in the RSI sub-chart could be harbingers.
Recently, the price has been stuck on the upside of the blue uptrend channel. If gold follows the dollar to start the correction, watch the orange rectangle for the possible retracement area between $1809 and $1758. The RSI should retrace to the 50 level and probably break it down a bit.
This correction could slide on the upside of the broken downtrend. This will chart a regular breakout-pullback pattern.
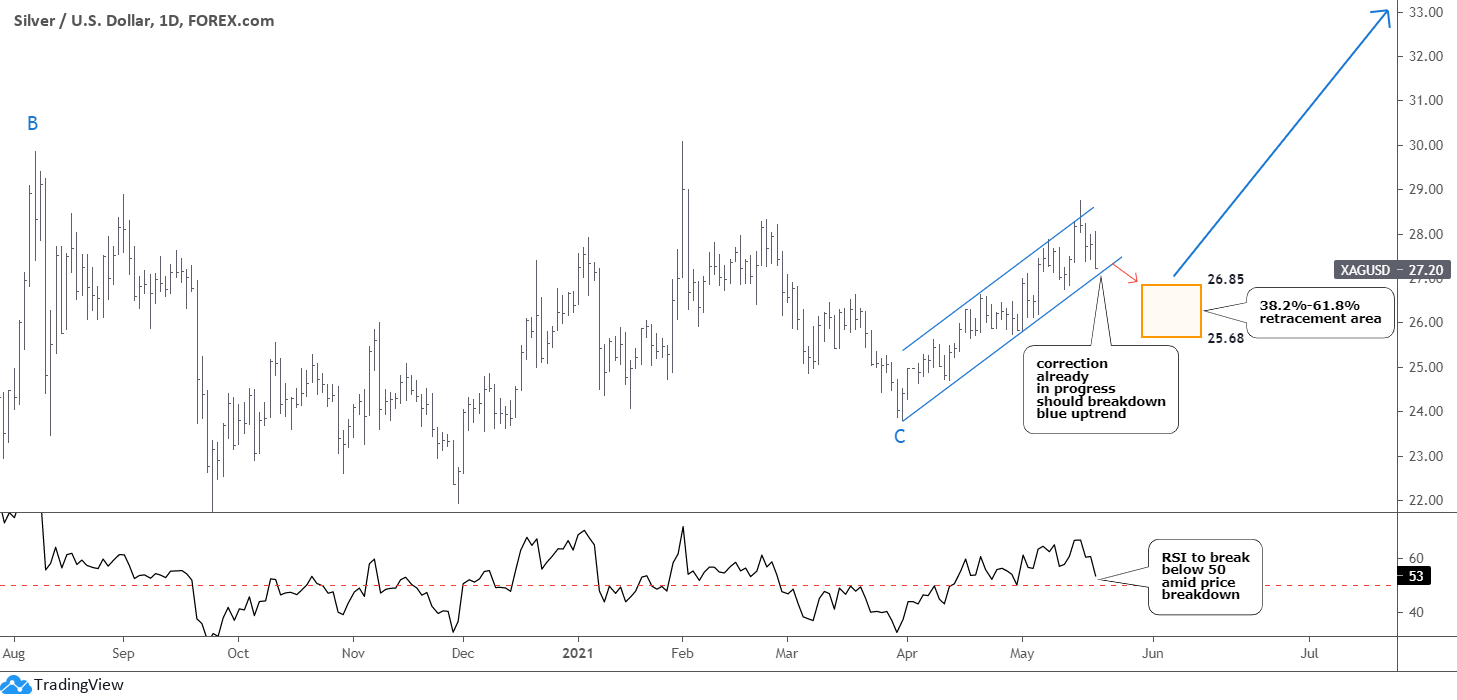
Silver is already falling from the top of the blue uptrend. So does the RSI as it almost reached the crucial level. That is why the correlation ratio with DXY is worse for silver as it started to retrace earlier.
To confirm the correction, the price should break down the blue uptrend. The retracement area of 38.2%-61.8% Fibonacci levels marked with the orange rectangle here as well. It is located between $26.85 and $25.68%.
Why is silver falling earlier than gold? It is quite a typical situation as the volatility in this metal is higher, and the market itself is thinner amid smaller liquidity. Therefore, it is wise to book the profit in silver earlier until it goes as the last buyers could absorb the first profit takers.
Let us see if the signs in the charts prove to be right about correction.
Intelligent trades!
Aibek Burabayev
INO.com Contributor, Metals
Disclosure: This contributor has no positions in any stocks mentioned in this article. This article is the opinion of the contributor themselves. The above is a matter of opinion provided for general information purposes only and is not intended as investment advice. This contributor is not receiving compensation (other than from INO.com) for their opinion.


