
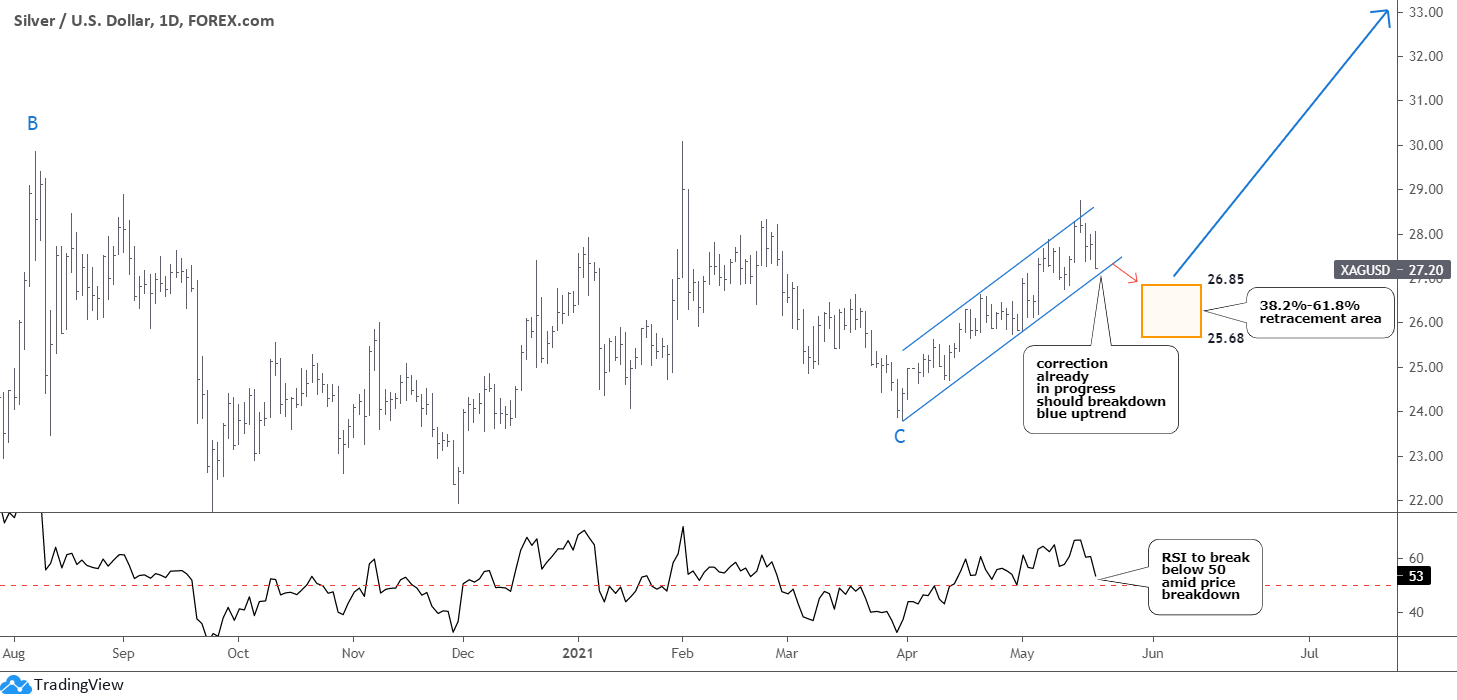
Let us start with the positive news; I spotted a hopeful sign in the silver chart. In my earlier update last month, I anticipated a correction to come in the dollar, gold, and silver charts.
The cleanest retracement among the assets mentioned above appeared in the silver chart as it met minimum requirements. Silver’s price broke below gray support, and the correction almost hit the 38.2% Fibonacci retracement level. It consists of two distinct legs down marked with red numbers.
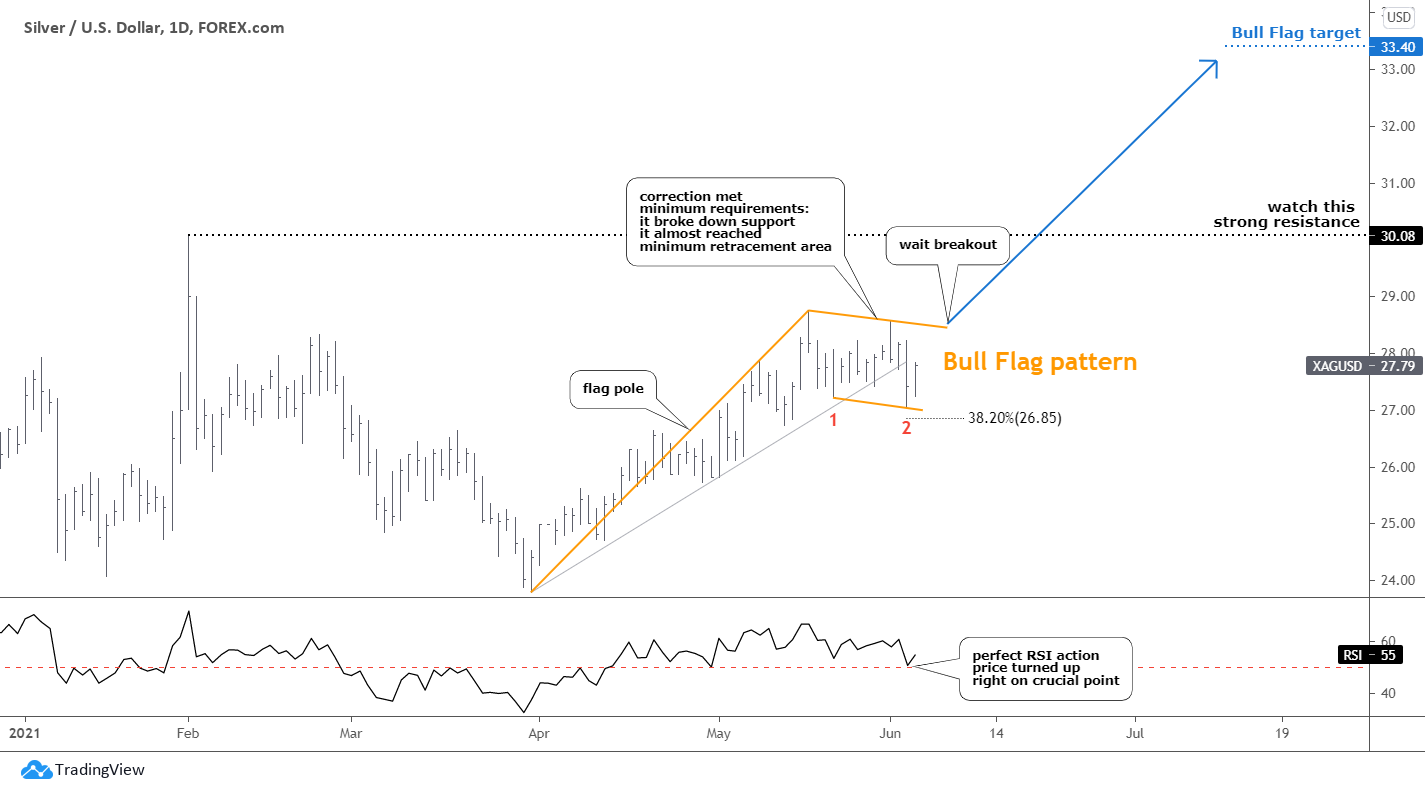
The RSI has shown a perfect action as the price turned up right when the indicator reached the crucial 50 level. It retraced quite well with the price to the downside, and now it is ready to support the development of the bullish pattern that I detected in the price chart.
The horizontal consolidation has built the well-known Bull Flag pattern (orange trendlines). I consider the entire preceding move to the upside as a Flag Pole as the Flag itself is pretty large, and it visually fits the model. The target for this model is located at $33.40 at the distance of the Flag Pole added to the breakup point. The price should gain 20% from the Friday close to hit the target.
One should wait until the price breaks the upside of the Flag to take action. There is strong resistance on the way to the aim point located at the former top of $30.08. Watch the price action there as the breakout will finally terminate the long-lasted large extended consolidation in the silver chart that started last summer.
I hope you took my reversal pattern alert seriously when it was posted last month for Bitcoin as a huge drop was forecasted then. It is incredible how accurately the price hit the preset target in the $30k area.
Bitcoin has been rich for patterns recently, as I spotted not one but two new models in the chart. I split it into two separate charts to let you examine them without confusion. I’ll start with the well-done short-term pattern.
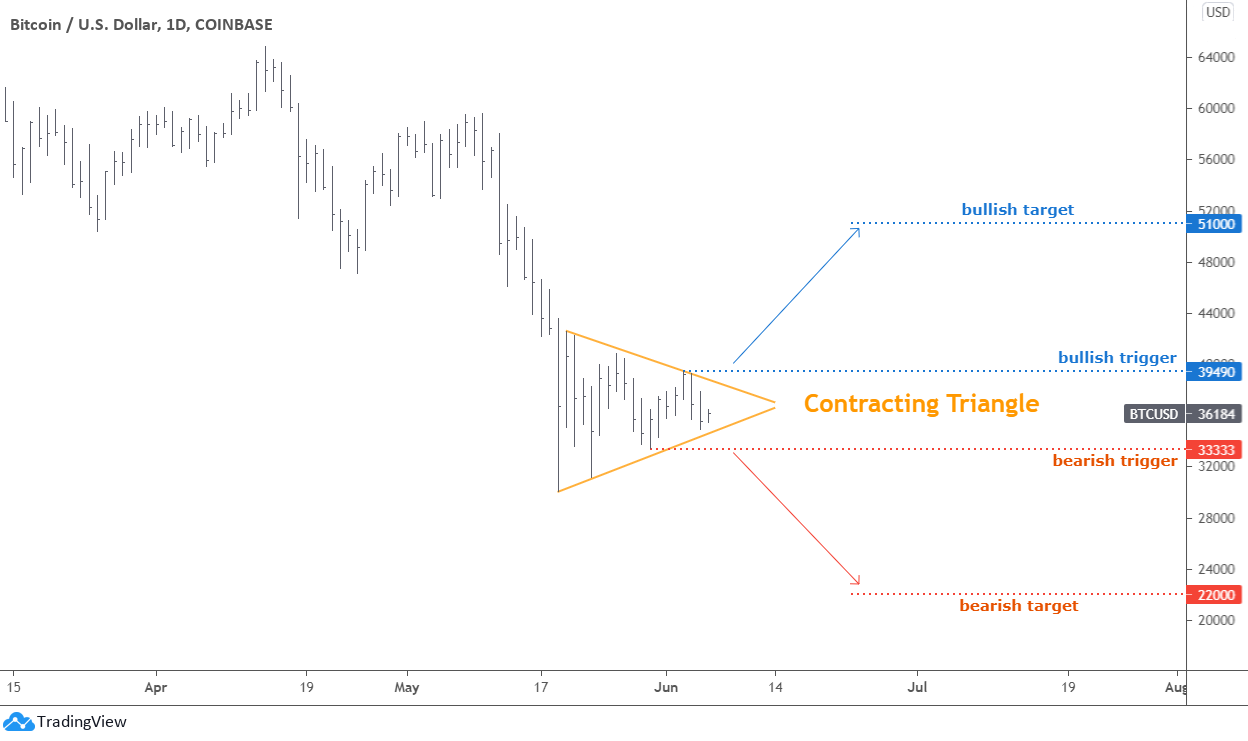
The combination of falling peaks and rising valleys has built the familiar Contracting Triangle pattern (orange converging trendlines). There are two options of how this model could play out.
The bullish scenario is marked with blue annotations. The price should first break out of the triangle, and then there is a bullish trigger at $39,490 to confirm the upside move. The bullish target is set at the distance of the widest part of the triangle added to the breakup point. It is located at $51k with a hefty gain of 40%.
The bearish option is highlighted with a red color. The price of Bitcoin should break down the pattern, and then it should move through the bearish trigger at $33,333 to confirm the drop. The target is located in the $22k area near the former all-time high established in 2017. The price should lose 40% to get there.
There is another potential pattern that has been built into the Bitcoin chart.
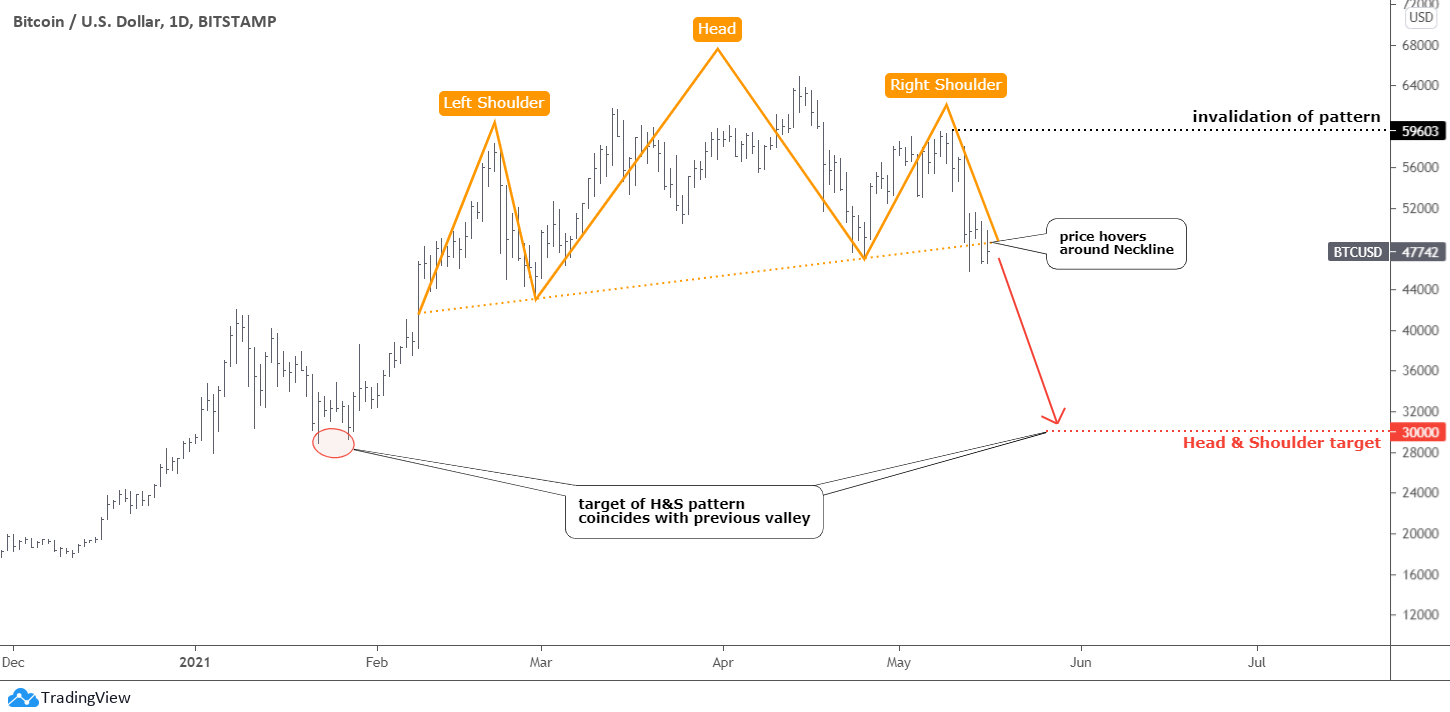
I know this is the “nightmare” chart for “HODLers.” I have to share with you what I see, as I am your devoted friend. We already witnessed how powerful that pattern was recently when the price of the leading coin collapsed to hit the target of $30k.
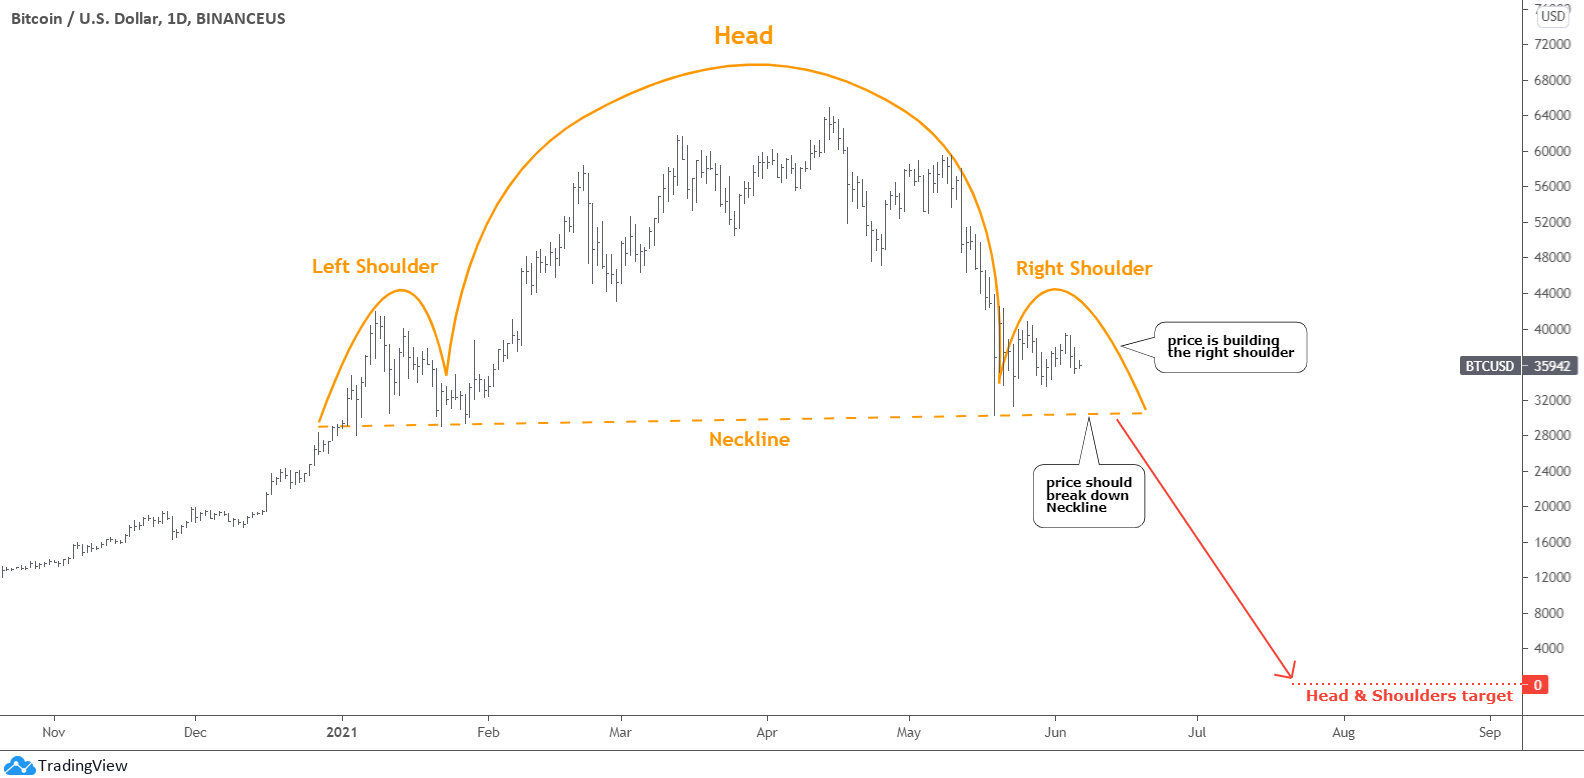
One could say – this man sees only Head & Shoulders patterns. Nevertheless, it is here building in the blind spot of a short-term chart. If we zoom out, we could see it. It is almost perfect technically, although it looks like a monster - an atomic mushroom cloud or a giant octopus with a large head.
The pattern is yet to be completed as the right shoulder is still in progress. The price could spike again to mirror the left shoulder. The main trigger to the downside is the dashed Neckline. The breakdown of it would open the way for a massive sell-off of Bitcoin.
What about the target? This is the worst news for crypto enthusiasts. The height of the Head is $35k, the Neckline breaking point is in the $30k area, and it means that the target should be negative – minus $5k! Last year I already had a negative number during calculation with the crude oil (https://www.ino.com/blog/2020/04/crude-oil-eyes-10/). That negative number target I skipped, but it was prophetic as oil futures sank below zero. However, I think it is impossible for Bitcoin, as there is no storage issue, so I put the target at zero level.
In my last post, I asked your thoughts about the future of pioneer cryptos like Bitcoin. Most of you chose that these first coins would survive. Let us see if we can enter the next stage with enhanced coins as progress never stops. Please feel free to share your thoughts below to enrich our view.
Intelligent trades!
Aibek Burabayev
INO.com Contributor, Metals
Disclosure: This contributor has no positions in any stocks mentioned in this article. This article is the opinion of the contributor themselves. The above is a matter of opinion provided for general information purposes only and is not intended as investment advice. This contributor is not receiving compensation (other than from INO.com) for their opinion.
No one can ban bitcoins nor Bitcoin-the-coin itself ever, unless e-mail and the internet are turned off altogether. The only thing you can ban (or regulate the hell out of) would be some portion of Crypto-to-fiat exchange but this is also true with all Forex trading -- and that has not gone away so far either, has it? Now, while regulation makes things a lot harder -- and would, therefore, be detrimental for price --, Bitcoin has done pretty well despite these regular "announcements": it was "on the brink of being banned" in 2013, 2016, 2017 and then some, but these threats only affect fake-news believers and, hence, can make a certain dent in the chart. The fact alone that Bitcoin-the-coin (along with all the other well-established Cryptos from Litecoin, Dash, PiVX, Ether to Monero, Peercoin, BitcoinCash and even including something like Dogecoin) is predominantly horded for their store-of-value properties, and not traded (and taxed) to go in and out of fiat all the time, means that Crypto as an asset class has always SOME value. It will not go away, now that it has been invented, released and "discovered" by increasingly large numbers of people. It will only fluctuate in value (maybe severely) depending on how dumb the investor herds are that make it deviate from its utility value at any given time.
Pricing models for Bitcoin put BTC at $10,000 in November 2017. That price was hit (with 6-day accuracy), overshot to $19-oddK and broke back below $4K, all the while "being worth" $10K; such are the swings in Crypto). Would be interesting to look up whether or not any head-and-shoulders existed back then (I haven't yet). According to the same model, today's BTC value is roughly $95,000, but we're not even close. In light of that undervaluation, it'll likely overshoot again (maybe a lot more) and certainly fall back after that, once we start to catch up. Go figure.
While one can make money speculating on bitcoin (I have). I think anyone who bought above $30,000 is going to be very sorry. Once large governments in large population centers such as China, USA, India, etc ban bitcoin outright and/or start issuing their own CBDCs (central bank digital currency). Bitcoin will go back to Ethereum-like price levels ($4K to $5K) if not go to zero.