
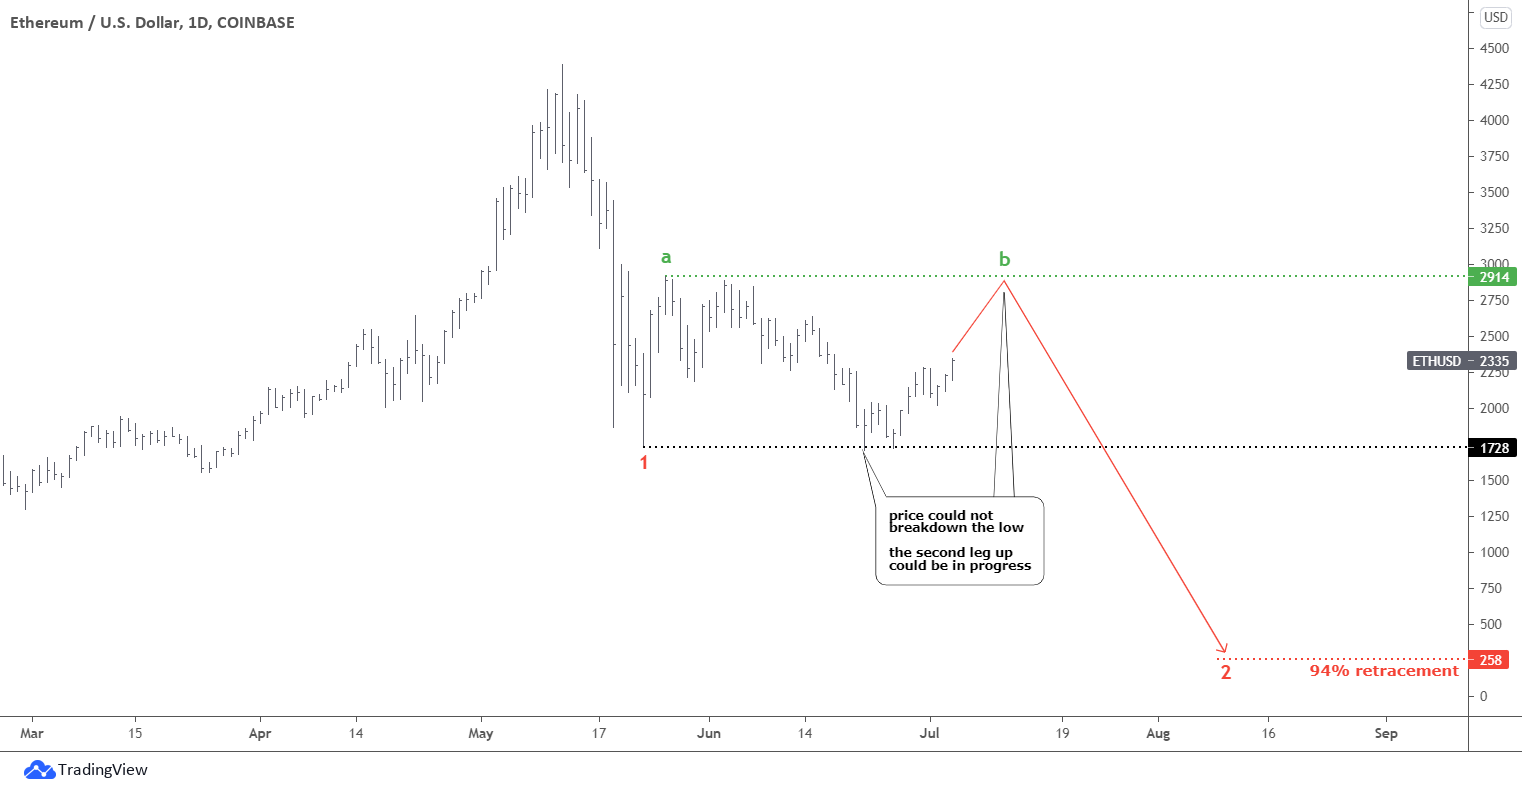
You hit it right when you bet that Ethereum would go higher this July as I called for a complex correction to limit the growth of this cryptocurrency around $3k.
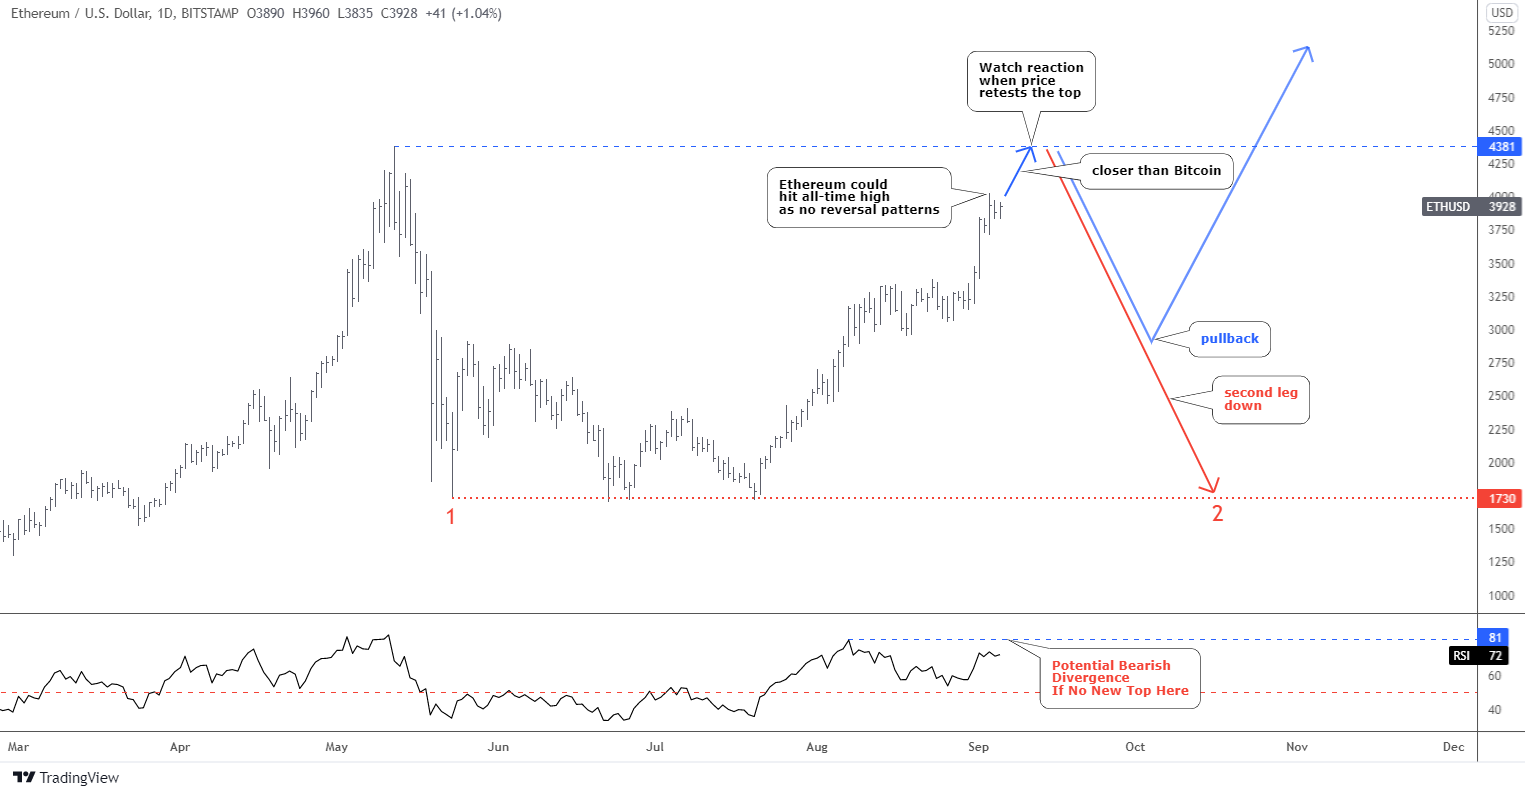
The price hit that upside barrier and stopped there for a while within a visible sideways consolidation. After that, it broke to the upside, as the pause was a harbinger of the uptrend’s continuation. The price quickly hit the $4k handle, and now we could observe a minor consolidation.
The chances are high that Ethereum would retest the all-time high around $4.4k. Therefore, it is better to watch closely how the price would react there. The RSI shows a potential Bearish Divergence; the indicator did not establish a new top while the price did. This could result in two paths.
The blue zigzag shows a possible deeper pullback to emerge before the price could continue growing. The Fibonacci retracement levels could help to visualize the levels between 38.2% and 61.8%.
The red down arrow shows the path of a second leg down as I originally anticipated. It could retest the valley of the first leg down at $1,730.
Ethereum outperforms the main coin; we can see it clearly in the next chart.
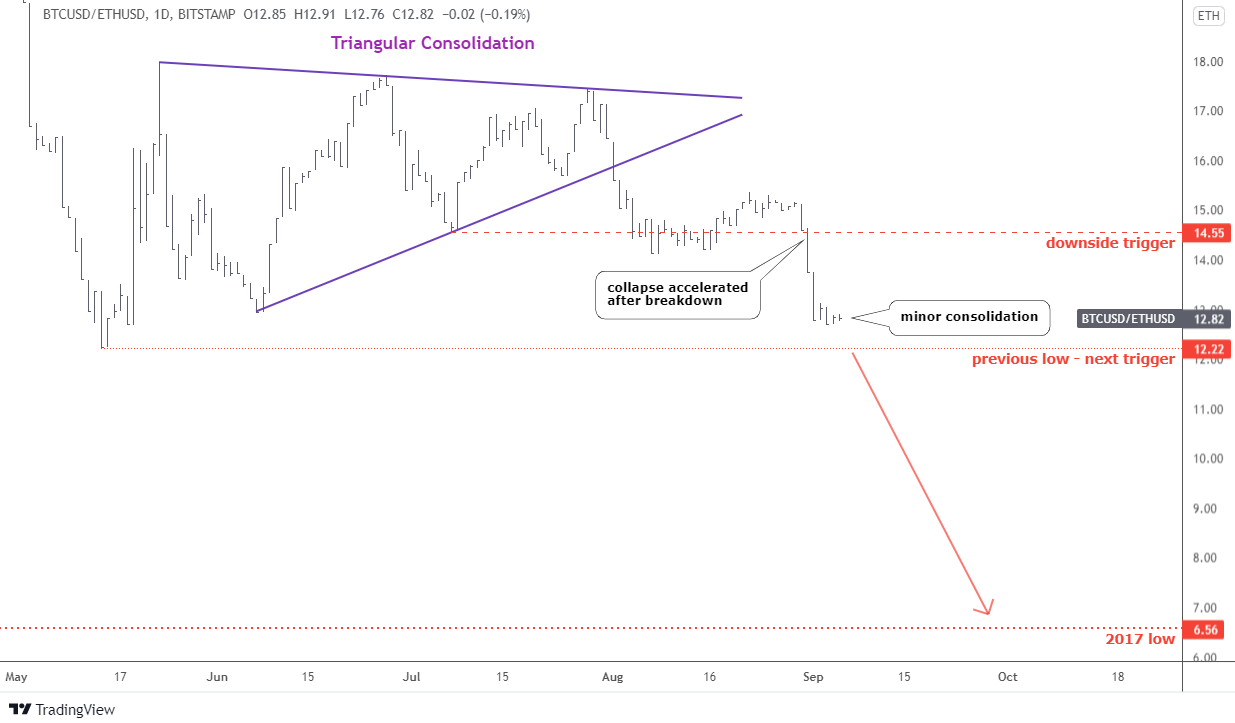
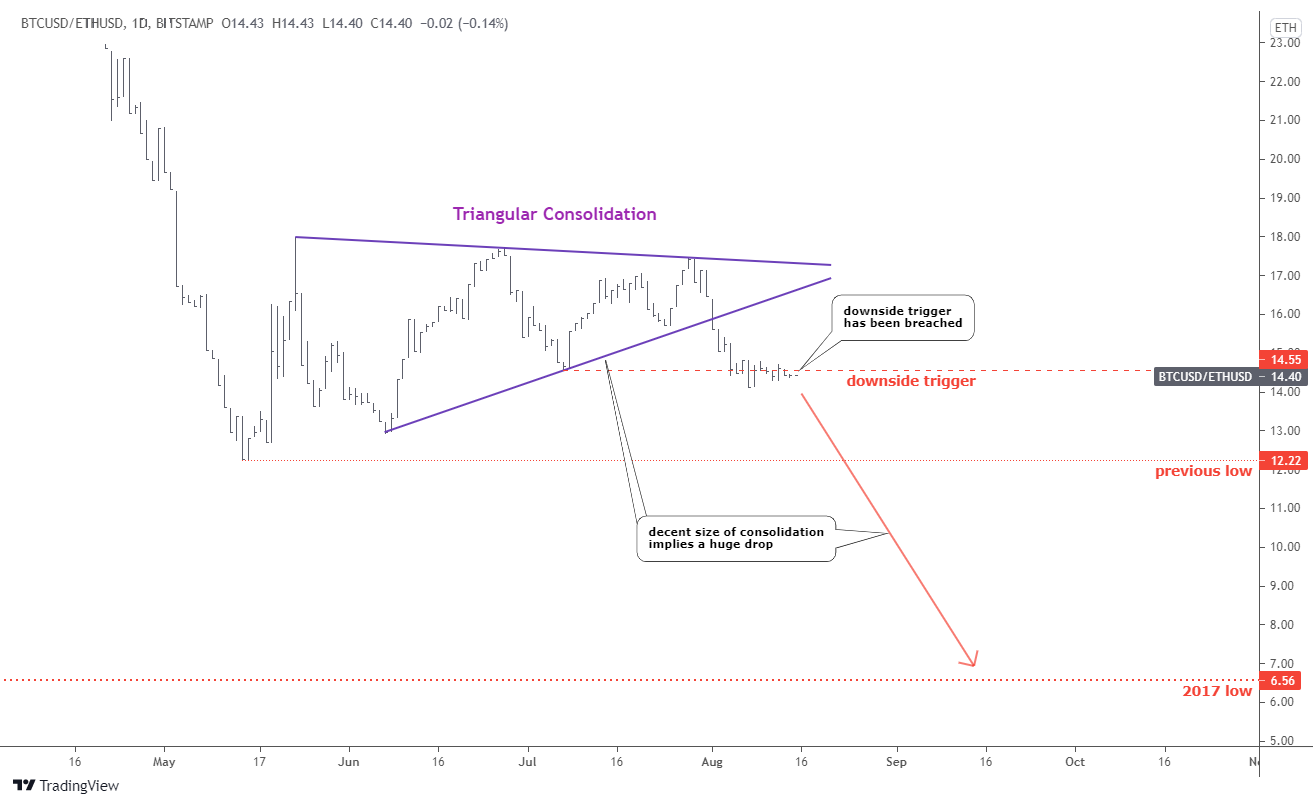
The BTC/ETH ratio goes in line with my expectations posted last month. The collapse of the ratio accelerated amid another breakdown of the downside trigger after a small consolidation. It quickly reached the area close to the previous low of 12.22 ETH. This would be a new trigger to the downside.
Currently, the price is in a minor consolidation, as it accumulates a new momentum for another breakdown. I supposed earlier that the ratio could drop lower down to the valley of 2017 at 6.56 ETH, as the purple Triangular consolidation is huge.
You were right last time, as most of you thought that Ethereum would outshine Bitcoin. The following visualization of the crypto market confirms it.
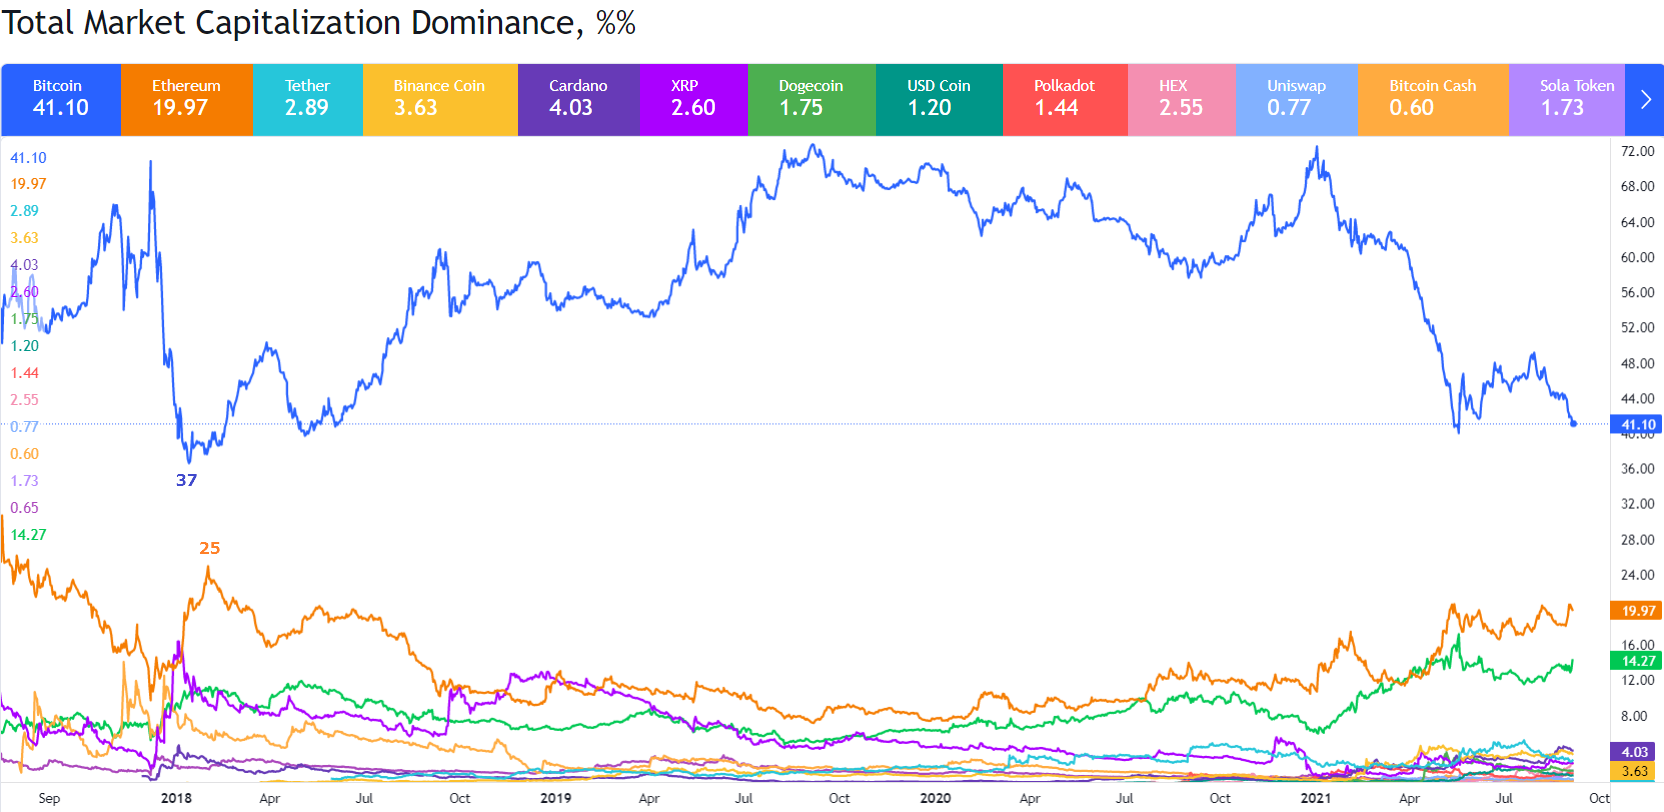
Chart courtesy of tradingview.com
The capitalization share of Bitcoin drops further down as it almost reached this year’s low of 40%. The next marked level is at 37% - it was the weakest dominance level in 2018.
Ethereum, on the contrary, advanced close to this year’s maximum of 21%. Thus, the next target is the top dominance level of 2018 at 25%.
The main coin moves higher very slowly, although two bullish setups emerged and aren't active yet.
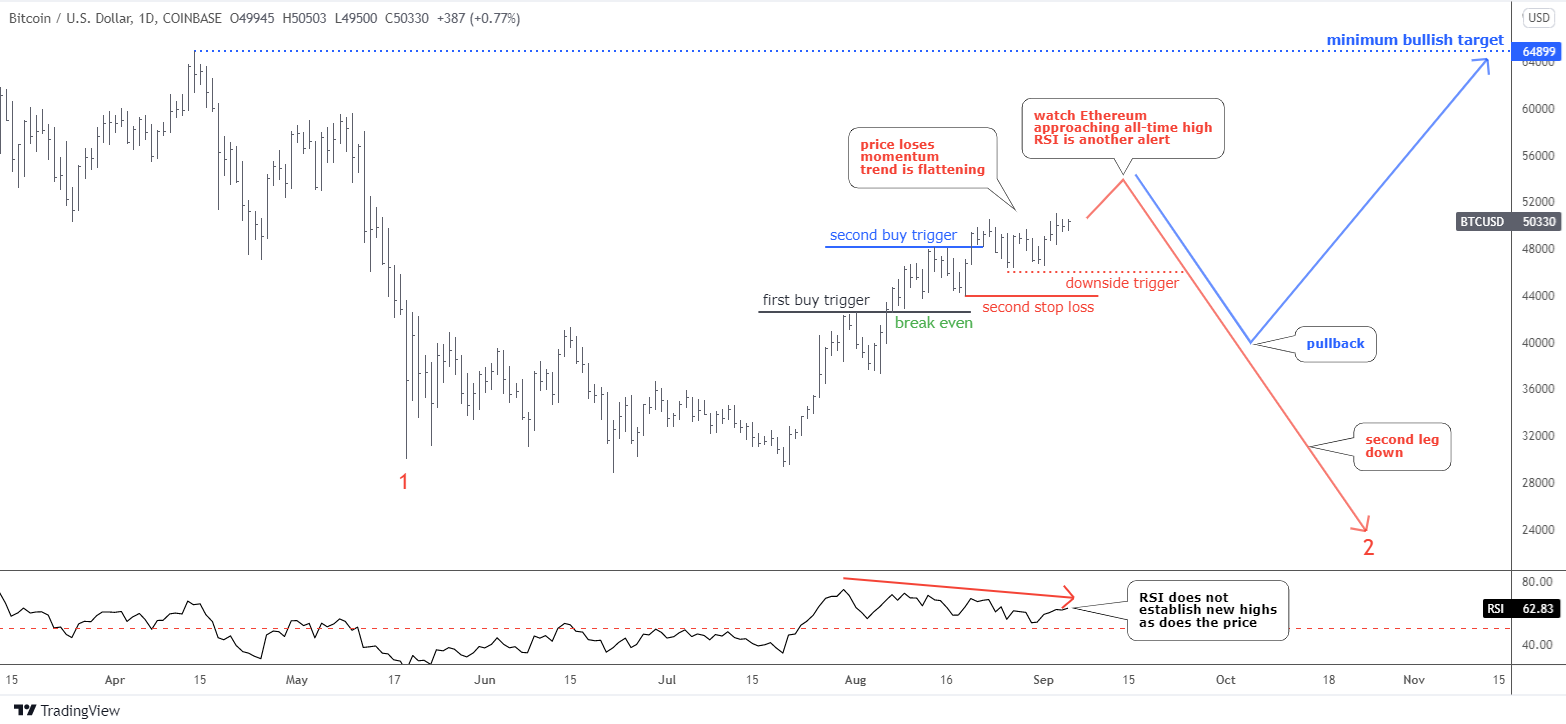
Bitcoin underperforms Ethereum, and the latter is going to hit the all-time high target soon. This puts the risk on the further advance of the main coin as profit-taking in Ethereum could set the barrier for Bitcoin then. Therefore, I recommend you watch the second coin closely for further clues.
The flattening uptrend is another worrisome factor. The price dropped below the second buy trigger after activation. It was a deep 61.8% pullback as we witnessed only two small 38.2% setbacks before.
Add here the accumulated Bearish Divergence in the RSI sub-chart. The indicator fails to establish a new high with the price one by one.
Let us assume in figures if Ethereum is going to gain another 10% to retest the all-time high of $4.4k; it could bring Bitcoin in the $52-55k range considering its lagging behavior.
I put two paths to copy Ethereum with the same outcomes.
The blue path implies an accumulated necessity of the market to book the profit and make a retracement ahead of another rally.
The red path shows the second red leg down within a large correction.
Intelligent trades!
Aibek Burabayev
INO.com Contributor, Metals
Disclosure: This contributor has no positions in any stocks mentioned in this article. This article is the opinion of the contributor themselves. The above is a matter of opinion provided for general information purposes only and is not intended as investment advice. This contributor is not receiving compensation (other than from INO.com) for their opinion.