
The knowledge of chart structure helps to navigate the market even when the latter surprises traders.
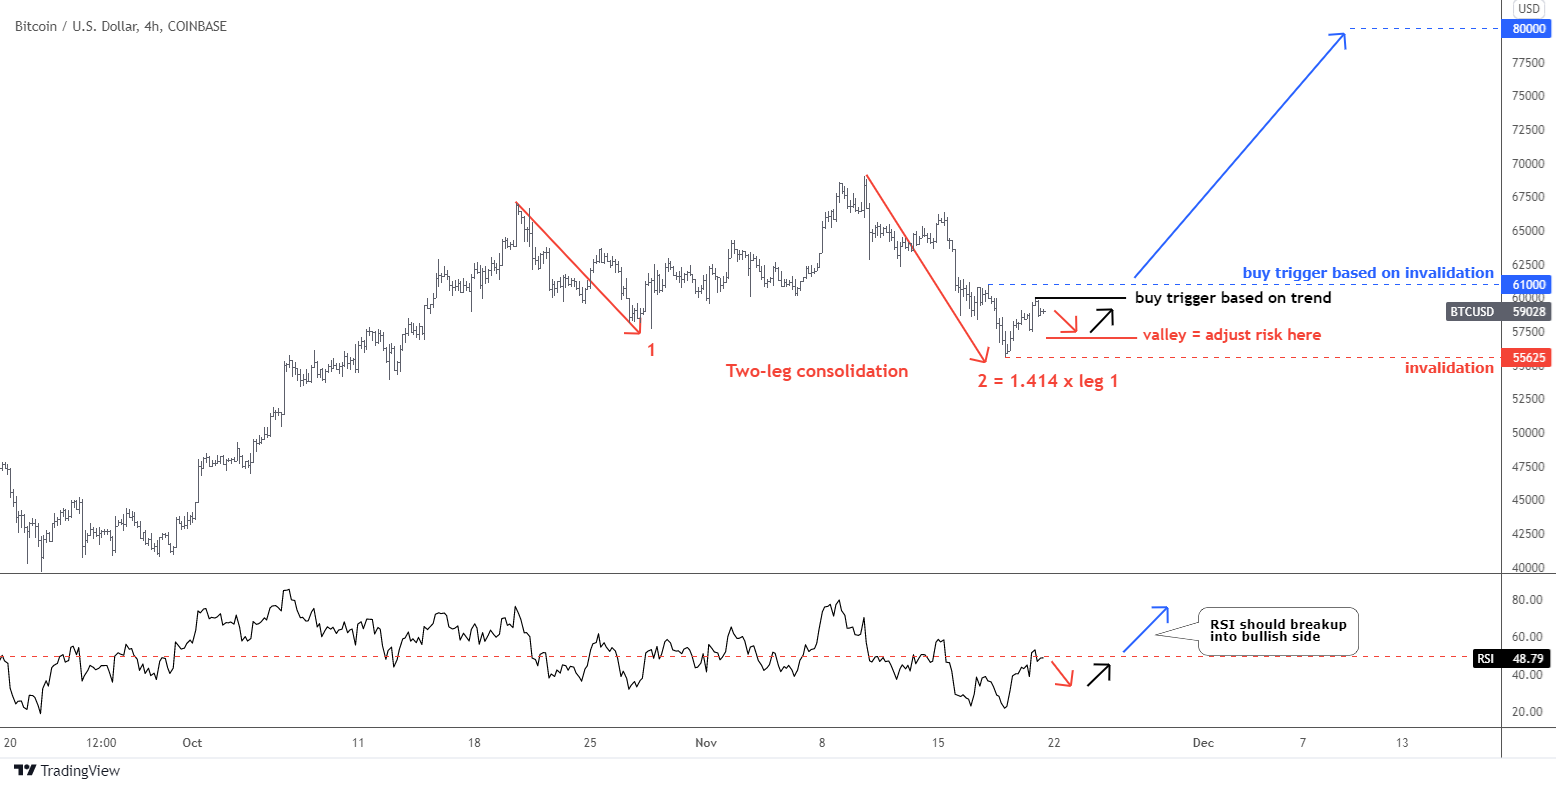
Bitcoin dropped a little bit later than I expected, creating a complex structure. The main coin updated the all-time high as it hit the $69k mark. If we look deep into the structure in the 4-hour chart above, we find that it was a part of a large two-leg consolidation (red down arrows). The new record high was established within a "joint" connecting two legs down.
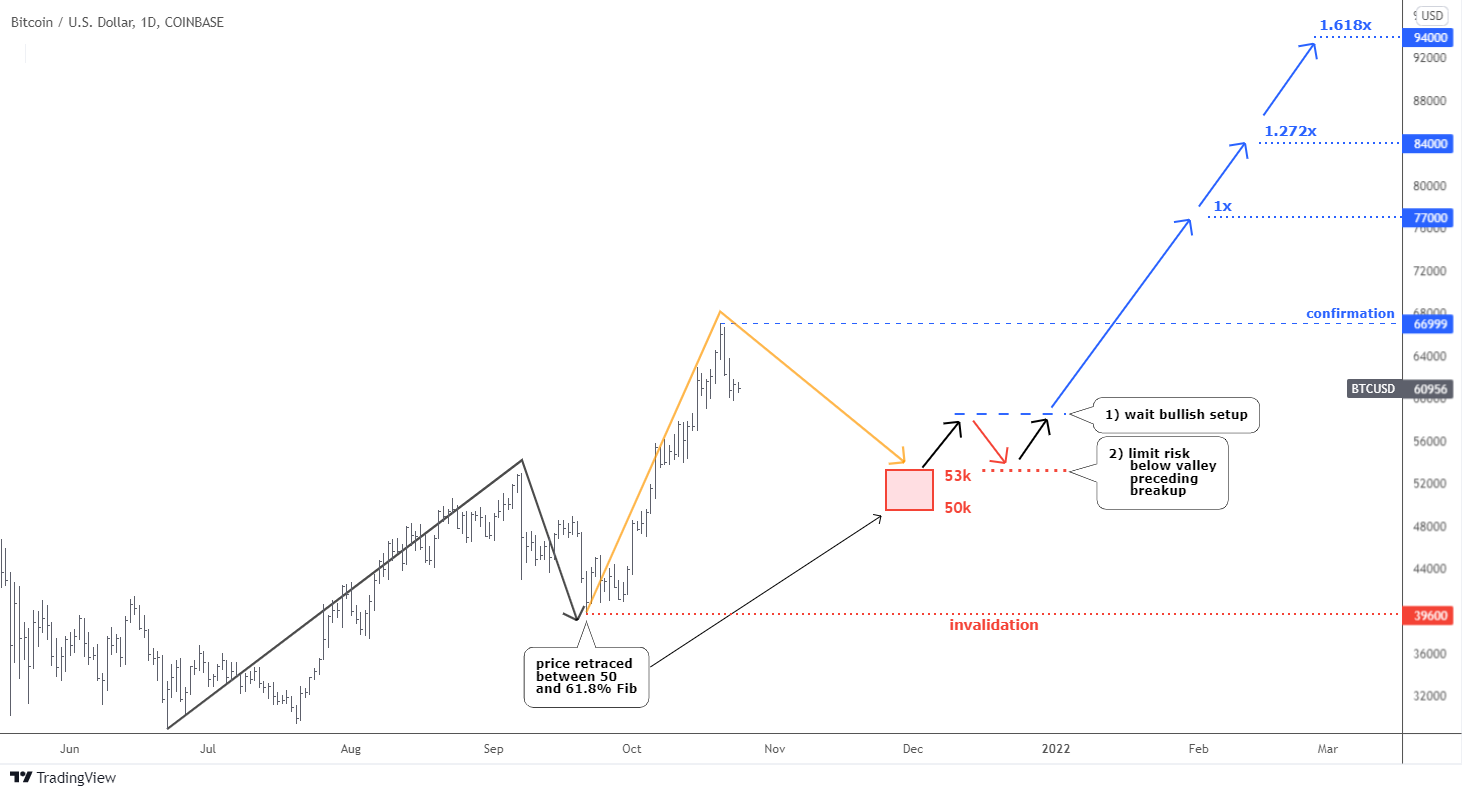
The second red leg emerged of a bigger size of 1.414x of the first leg down. The rare Fibonacci ratio played out there. The consolidation reached the bottom of $55.6k last Friday. The price almost reached the preset retracement area between $50k and $53k shared with you in an earlier update.
The following V-shape reversal brings hope for building a new buy setup for Bitcoin. The price advanced well enough as it eyes the buy trigger based on the invalidation of the earlier move down at $61k. It is located at the top of the preceding consolidation (blue dashed price line).
Another buy signal is located one thousand lower at $60k (black horizontal segment). I put it in using the trend development approach. I consider the current move up as the initial. Traders should wait for a minor retracement to $58k-$57k (38.2% – 61.8% Fibonacci retracement levels) and the following breakup of the top of the initial move beyond $60k.
The target is located at the distance of the preceding move up started at the end of September. I rounded it down to $80k to be conservative. The invalidation level is below the most recent bottom of $55.6k. The risk/reward for this setup is 3.5 for the $61k trigger and 4.5 for the $60k signal. Both are sound.
The buy setup for Apple Inc. (AAPL) is in green. The price gain since the bullish setup was triggered reached a hefty +27% already. When I asked how you would manage the trade, the majority opted to move the stop to breakeven around $127. The next popular answer was to book partial profit.
I see certain worrisome signs in the chart of AAPL; I think it is worth seeing.
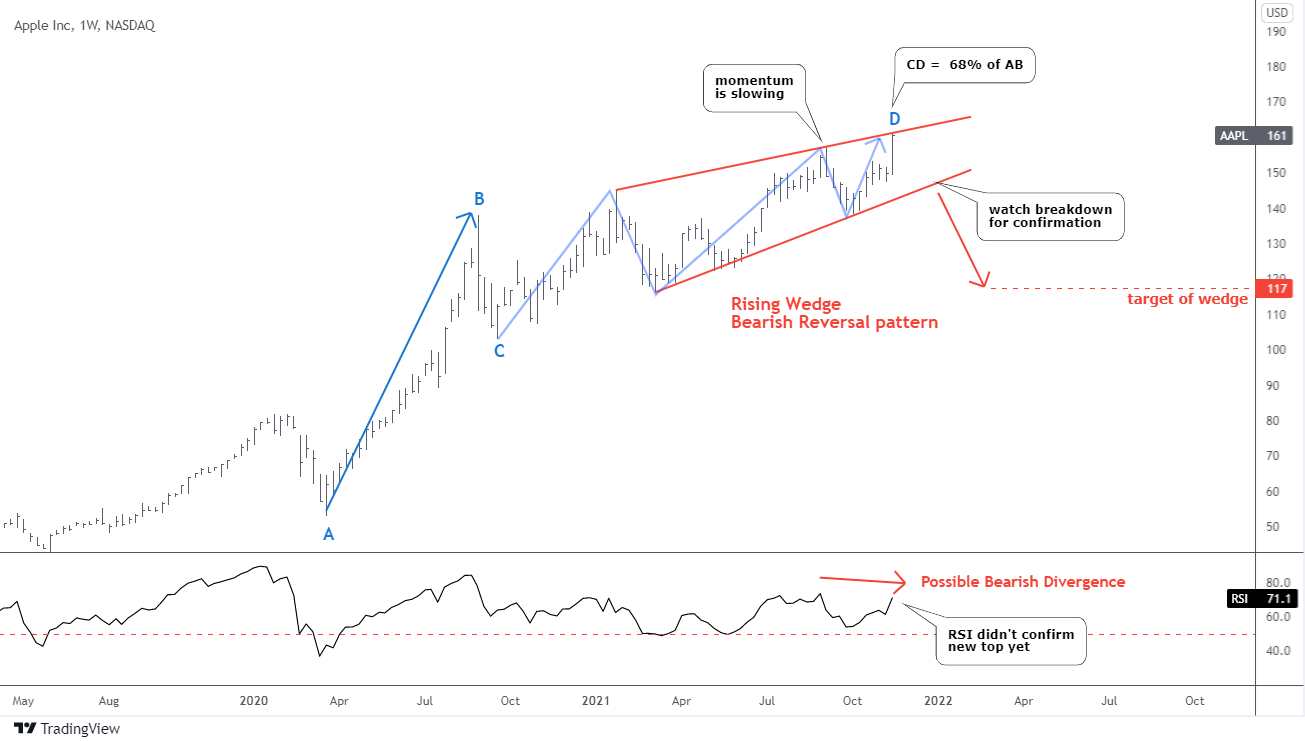
The most apparent alert comes from the RSI indicator as the potential Bearish Divergence is building there. Unfortunately, the indicator didn't confirm the new top in the price chart as it has a lower reading. Previously, such a mismatch has smashed the price down to $116 from $145.
Another visible sign is the slowing momentum of the current trend. The angle of the CD part is less sharp than that one of the AB part. At the same time, we can see that the CD part is much more extended on the time scale, although it could travel only 68% of the AB part on the price scale. Each subsequent segment to the upside within the blue zigzag of the CD part is smaller on the price scale. It could signal about fading uptrend.
Last but not least, the alert comes from the Rising Wedge reversal pattern that was spotted on the chart of AAPL. A series of higher highs and higher lows has shaped this model. The confirmation of the pattern would come with a breakdown of a lower side.
The target is located at the distance of the pattern's widest part, subtracted from the breakdown point. It was set at $117. The pattern will be invalidated once the price would break above the highest point inside of the pattern.
Intelligent trades!
Aibek Burabayev
INO.com Contributor, Metals
Disclosure: This contributor has no positions in any stocks mentioned in this article. This article is the opinion of the contributor themselves. The above is a matter of opinion provided for general information purposes only and is not intended as investment advice. This contributor is not receiving compensation (other than from INO.com) for their opinion.
welcome to 53k LOL
your btc analysis is complete nonsense. see you at 53k
YES YOU GOT IT. BTW WATCH THE EURO COLLAPSE DUE TO FORCED LOCKDOWNS WHICH WILL MAKE THE DXY USD RUN UP LIKE A SCALDED MONKEY WHICH IN TURN CAUSE TRIP AND FALL OF BITCOIN. ALL PLANNED OUT BY THE DEEP STATE ROTHSCHILD BANKING SYSTEM.