
The Refinitiv/CoreCommodity CRB Index (CRB index) is a commodity futures price index. It was well known under the name Thomson Reuters/Jefferies CRB Index before renaming. The CRB index is the gauge of the commodities market, which is comprised of 19 items as quoted on the NYMEX, CBOT, LME, CME, and COMEX exchanges within four following groups:
-
• Petroleum-based products (based on their importance to global trade, always make up 33% of the weightings)
• Liquid assets
• Highly liquid assets
• Diverse commodities
It includes aluminum, cocoa, coffee, copper, corn, cotton, crude oil, gold, heating oil, lean hogs, live cattle, natural gas, nickel, orange juice, silver, soybeans, sugar, unleaded gas, and wheat.
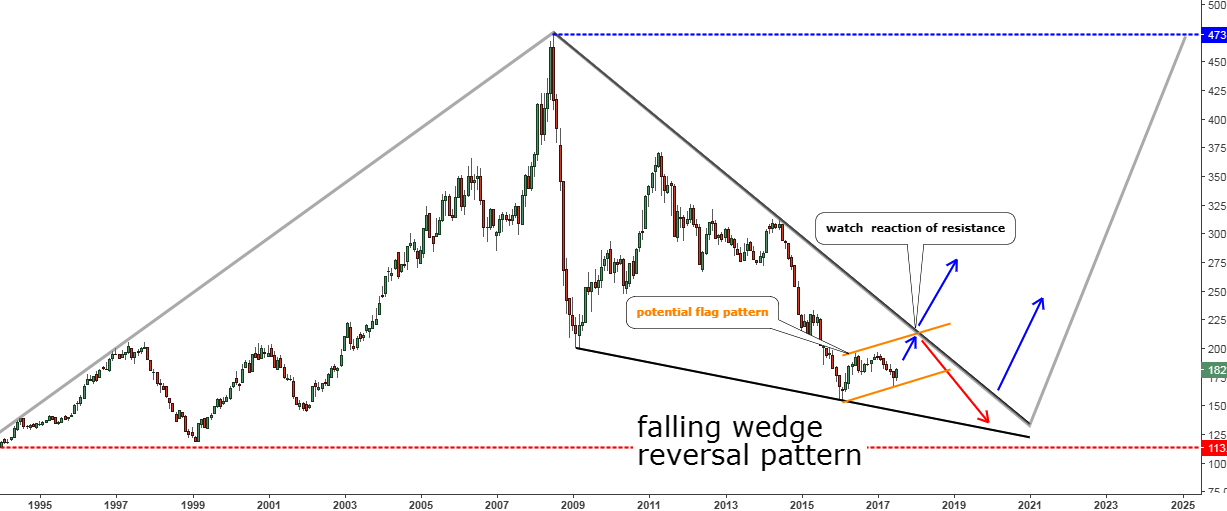
More than four years ago, I shared with you a big map of the CRB index with a long-term outlook. (Original chart is below)

Back then, I believed that the global commodity prices were just in a joint (corrective phase) within a Falling Wedge pattern between growth cycles highlighted with gray segments. It was not evident that time as tactically, the CRB index was in a downward spiral near the all-time low.
Then I proposed two medium-term options:
-
1. orange flag with the following red down arrow had shown another drop after a correction
2. the blue up arrow outside of the Falling Wedge pattern had indicated the immediate Bull Run
In 2018, I shared with you an update in the weekly chart below.
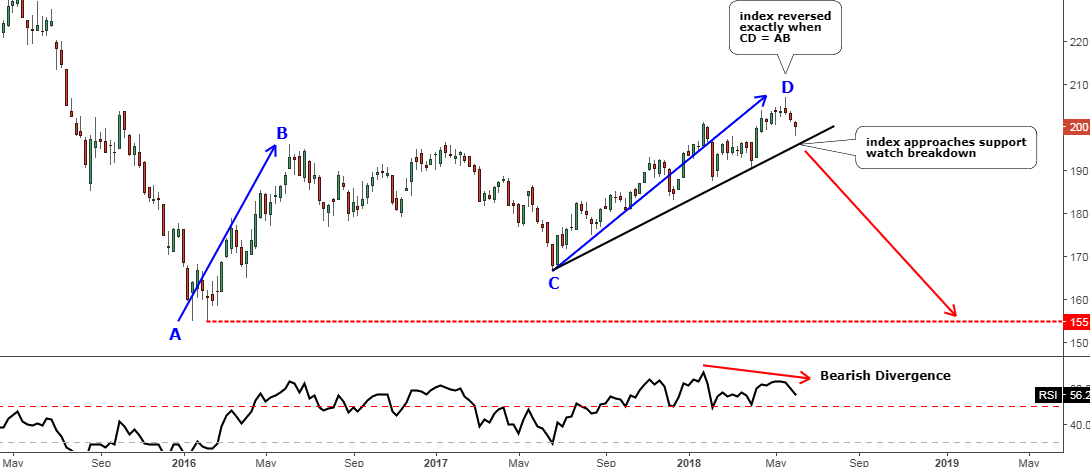
The price emerged within the orange flag pattern of the downside scenario in the first chart above. So, the upside move was eliminated then. This chart structure played out very accurately as the CRB index dropped like a rock hitting further below the preset target of $155 to establish a new all-time low of $101.
Let us fast forward to the present day in the current monthly chart.
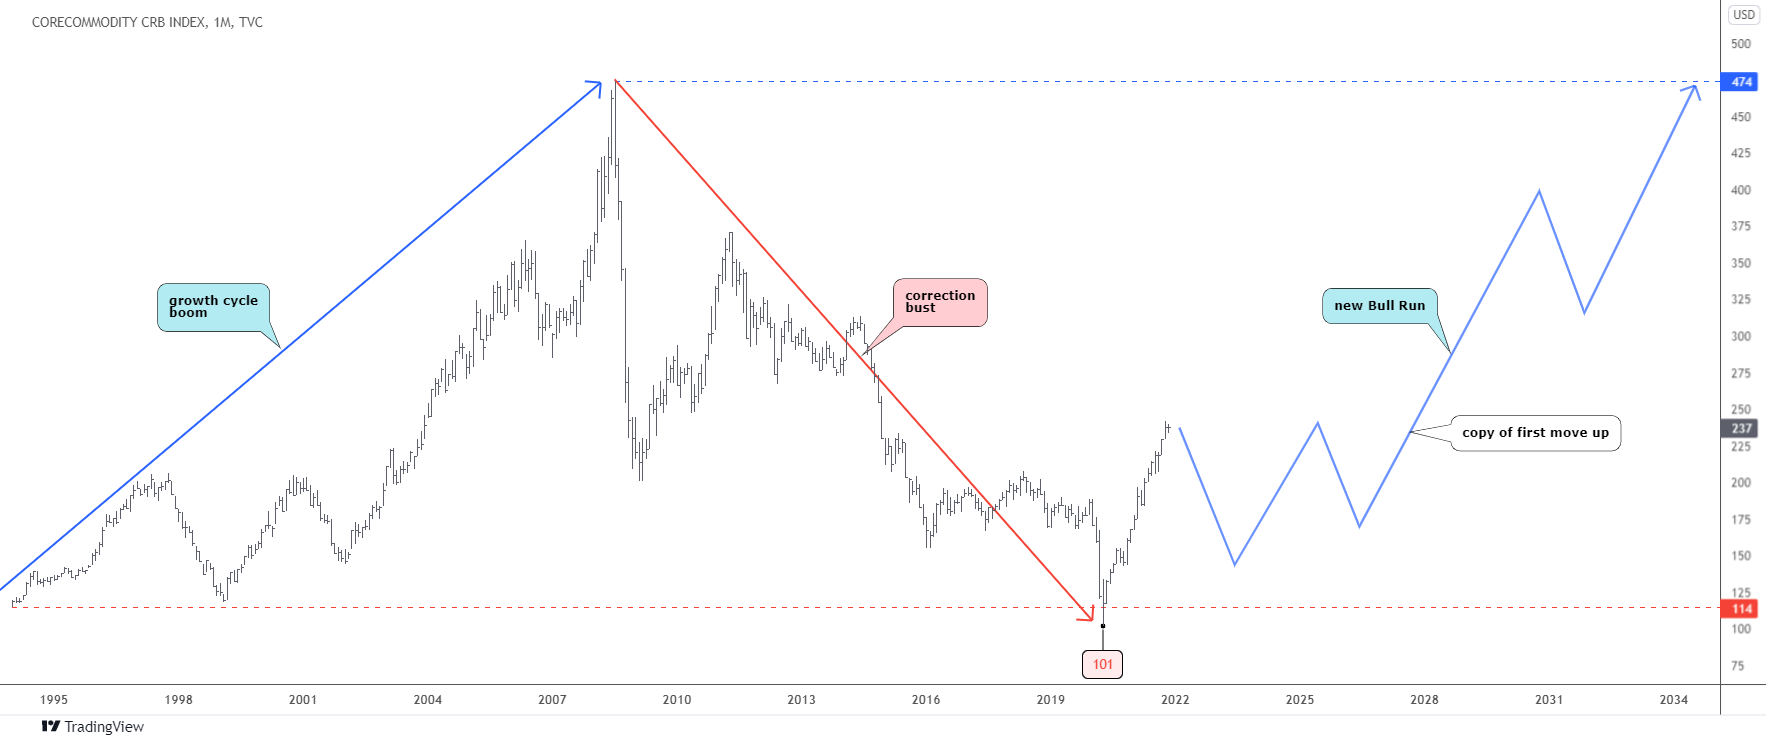
The CRB index made a V-shaped reversal right after it had established a new record low of $101. It was nimble to break out of the Falling Wedge pattern (not shown). The impulse of that move was strong as it has effortlessly surpassed a very strong barrier in the area of $200-210 (top of historical consolidations) like a knife through warm butter.
The possible structure of the upcoming Bull Run is not clear yet as we have only the initial move with a very sharp angle. Markets very rarely move all the way up without corrections. This is a traditional market; the chances are high that we could see a pullback at some point, maybe this year.
I copied the structure of the first move up from the left part of the chart. It shows a large complex correction to come to market to accumulate enough power for another rally. The structure could be different this time, although the direction will remain the same to the upside.
The current growth cycle could reach the top of the first Bull Run at $474 to complete the global structure.
Please share your thoughts in the comment section below if I missed something.
Intelligent trades!
Aibek Burabayev
INO.com Contributor, Metals
Disclosure: This contributor has no positions in any stocks mentioned in this article. This article is the opinion of the contributor themselves. The above is a matter of opinion provided for general information purposes only and is not intended as investment advice. This contributor is not receiving compensation (other than from INO.com) for their opinion.
The Main reason the commodity prices shall explode higher, is when the US dollar collapses...
Dear rex, thank you for sharing a valuable opinion.
During the last boom cycle the reason you have kindly mentioned above played out well.
The severe drop of DXY index from 120 in 2002 down to 72 level in 2008 coincided with the rally of commodity prices.
Best wishes, Aibek