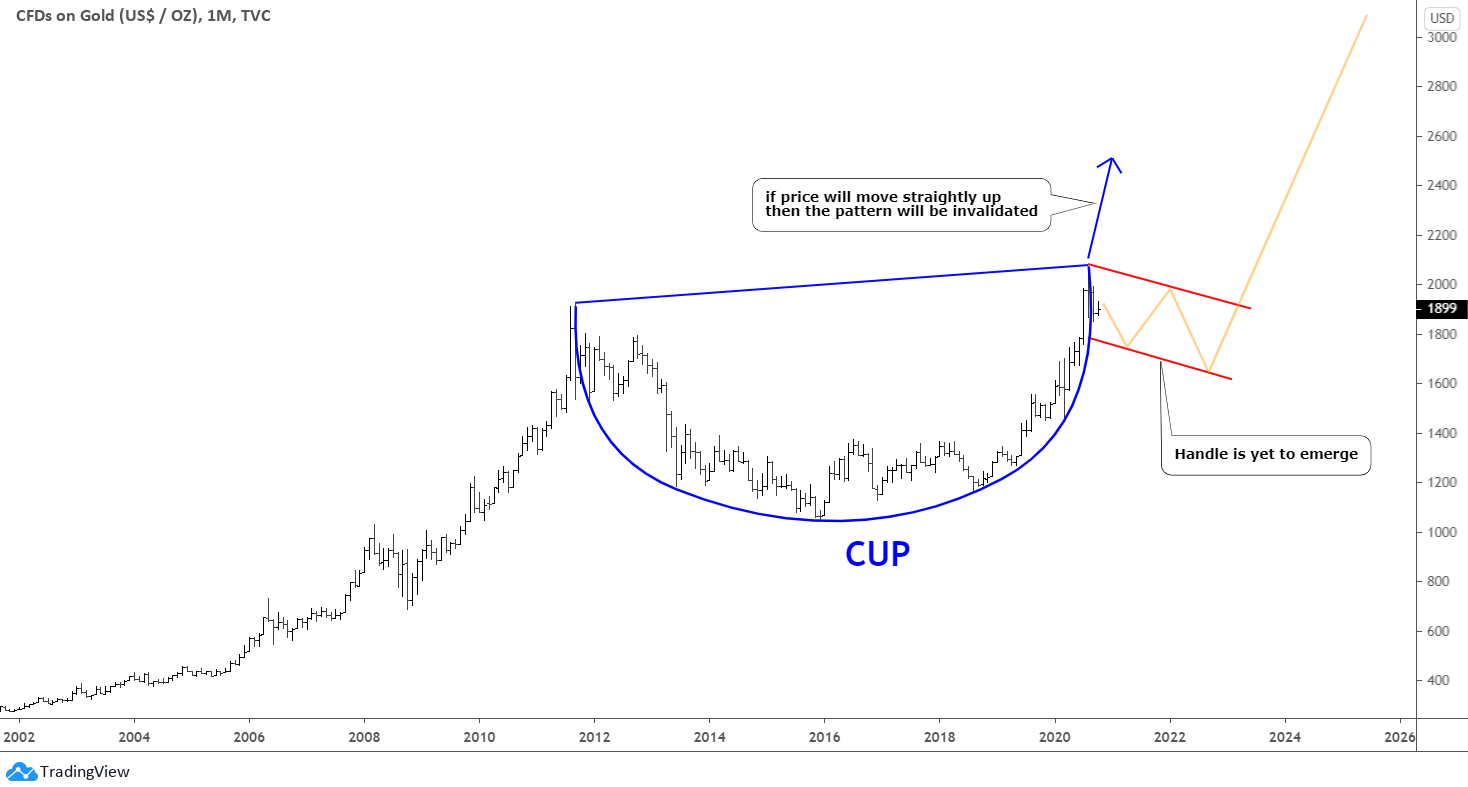
Back in October 2020, one of our readers suggested that the famous Cup & Handle pattern could have been built in the gold chart. I have checked his idea and visualized it in that very chart below from the past.
At that time, the main element Cup had already been shaped (blue). The final part of Handle was yet to appear. I highlighted the hypothetical trajectory with an orange zigzag in the declining red channel.
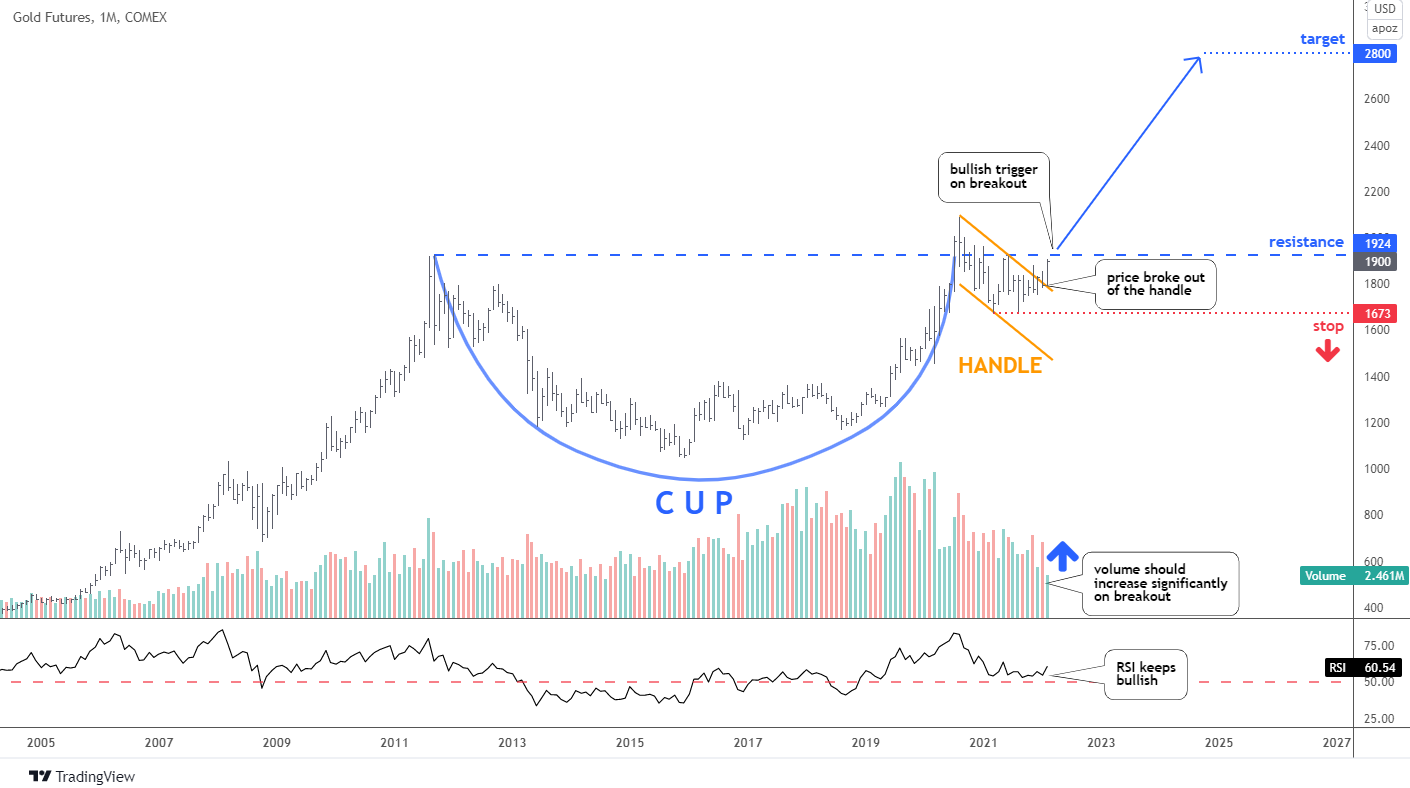
Let's see what is going on in the gold futures monthly chart below to check if that assumption came true.
Indeed, each and every opinion matters, as I always encourage you to share your thoughts in the comments. Hundreds and thousands of your eyes could see the market from a broad perspective. The reader's assumption has played out these days after more than a year since he shared.
The market has built the Handle part projected in 2020 almost as planned. The retracement was not too deep as it slightly pierced the 38.2% Fibonacci retracement level at $1,690 to establish the valley of $1,673. This is a good sign for the pattern. The price has spent seventeen months inside of the final part (orange). I warned readers, "it could take several years (for the market to build the Handle) as Cup has been shaped within long 9 years". This month, the price has managed to break up the Handle.
The futures price closed at $1,900 last week. It has come close to the bullish trigger set at the left top of the Cup at $1,924. However, it is not a big distance for an unleashed metal. I chose the futures price chart to highlight one crucial indicator, the volume. It should increase significantly on the breakout to confirm the ongoing demand pushing the price higher.
The RSI keeps a bullish stance, as it did not sink below the "waterline" of 50 amid the recent sell-off. Therefore, it supports bulls these months.
The profit target is located at the height of the Cup added to the breakup point. I highlighted it at $2,800 for you on the chart. The risk/reward ratio stands at a sound level of 3.5.
The failure to break up the next barrier could ignite the further collapse below the stop trigger of $1,673. This is the valley of the Handle part. In this case, there are two paths that could emerge.
The first downside path could be a more complex retracement, which could push the price down to the $1,500 level if new leg 2 is equal to leg 1. The depth of the correction will be more than 50% then, but still above 61.8%.
The worst scenario has already been shown last March in the “Wake-up Call for Gold”. It has been based on the similarity between the area in the chart after the left top of the Cup and the zone after the right top of the Cup. The outcome is terrifying, as the price in this scenario should retest the bottom of the Cup at $1,045.
Intelligent trades!
Aibek Burabayev
INO.com Contributor, Metals
Disclosure: This contributor has no positions in any stocks mentioned in this article. This article is the opinion of the contributor themselves. The above is a matter of opinion provided for general information purposes only and is not intended as investment advice. This contributor is not receiving compensation (other than from INO.com) for their opinion.


