
It is just amazing how many times you guess not only the direction but also the peaks and troughs of the prices of different instruments. This is crowd-thinking or crowd-analyzing, when the winning ideas are crystallized into the major wager.
This “market distortion” was spotted in July and it was updated this September. Almost all of you were betting that crude oil and platinum would meet on the price chart again. So, here it is in the chart below.
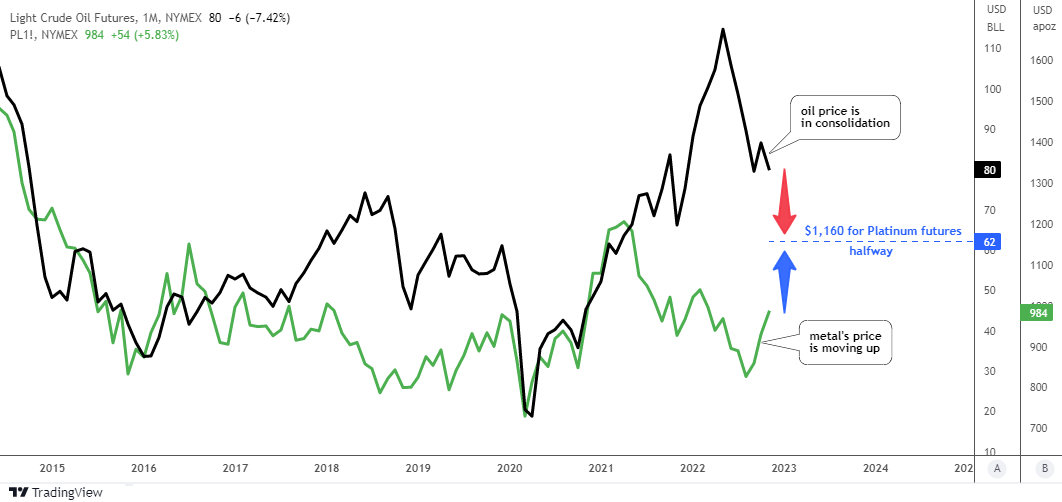
The magic of your major bet is right here in the making. As the oil price remains stuck in a sideways consolidation, the platinum price is taking quick steps towards "black gold".
In September, crude oil futures completed their mission as the initial meeting point was set at $75 and the valley was at $76. Hence, the consolidation that followed gave the metal a chance to catch up.
The updated meeting point has been recalculated to be set at $62 for crude oil futures and at $1,160 for platinum futures. This could happen in an ideal situation. Historically, however, one of the instruments has often lagged behind.
Last time I updated the platinum futures chart for you and it played out well according to the bullish option.
Let me update the oil futures chart this time as it has changed a lot.
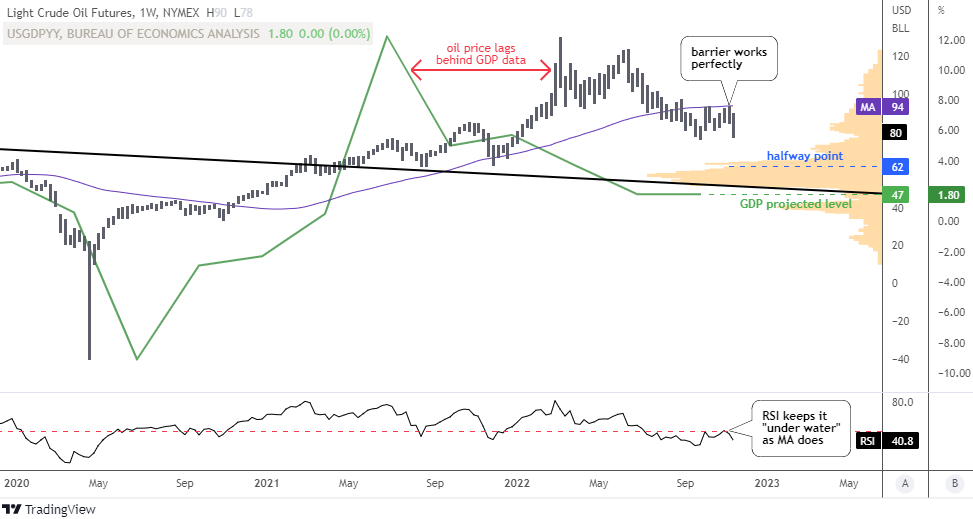
This weekly chart of crude oil futures above considers almost all options that are mentioned in the poll below except that the oil price will not move.
Before we start, let’s see the whole picture. I added for comparison the annual change in U.S. GDP data in the green line. The correlation is pretty strong as the rising U.S. GDP data is hand in hand with the strengthening oil price and vice versa.
In the past year, the green line has been decreasing and the time lag has thrown a bomb on the oil price only this year as it peaked in the spring and then fell from a $130 price level to the current $80s.
However, that is not enough to catch the GDP data and there is still a long way to go as it corresponds to the oil price of $47. This level is fortified with the Giant Falling Wedge, which used to be resistance around the $50 mark.
The moving average (purple) is still a valid barrier at $94 since it has held the oil price twice.
The RSI did it as well, as the reading is below the crucial 50 level.
The game is now between the “hammer” of the moving average ($94) and the “anvil” of U.S. GDP data ($47). The breakup above the $94 would increase the gap of the market distortion.
The halfway point at $62 is located right at the top of the largest volume area (orange). There are no other significant levels above it.
Intelligent trades!
Aibek Burabayev
INO.com Contributor
Disclosure: This contributor has no positions in any stocks mentioned in this article. This article is the opinion of the contributor themselves. The above is a matter of opinion provided for general information purposes only and is not intended as investment advice. This contributor is not receiving compensation (other than from INO.com) for their opinion.
Dont about the real facts it was just a opinion vote thankyou