
It is time to update the crypto charts as I spotted a strong alert in two major coins for you.
It is ironic that the signal comes from the same indicator that accurately predicted the rally of Bitcoin last November when the price was around $16k.
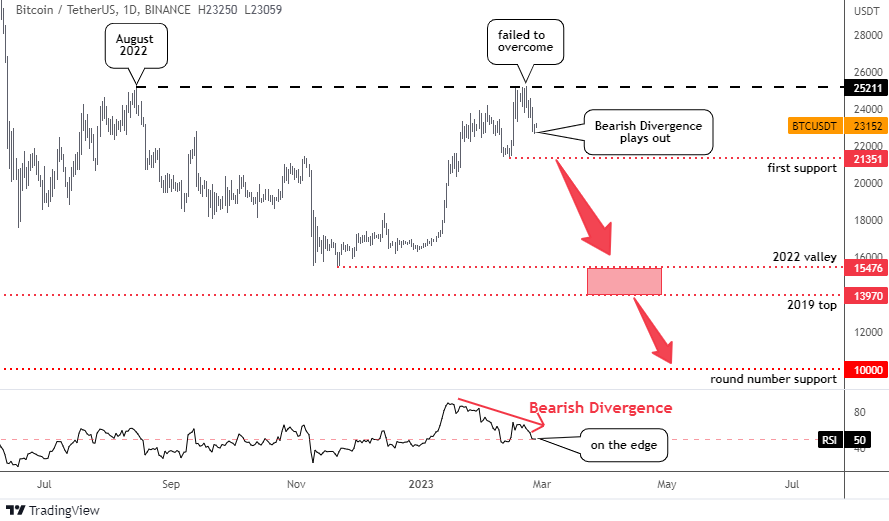
Indeed, the main coin has rallied for whopping 52% after the signal topping slightly above $25k. The previous peak of August 2022 at this level unexpectedly acted as a strong barrier that the price couldn’t overcome.
In my recent update last month I warned that “the bullish impulse should not fade until it touches the moving average around $27k to convince the trading community”.
Unfortunately for bulls, the rally has faded below the target. However, the majority of readers did not see this rally as a sign of a global market reversal.
This time, the same RSI indicator doesn’t confirm the most recent peak on the price chart as it shows a lower top. This is called a Bearish Divergence.
The price has already plummeted $2k from the maximum of this month as the signal plays out. The indicator’s reading is on the edge of 50 and further collapse would send more downside pressure on the market. This time the alert appears on the daily chart, though its magnitude could not be as strong as November that occurred on a higher weekly time frame.
The nearest support at $21.3k is located in the valley of this month. After that, there are no significant levels as the price could retest the low of 2022 at $15.5k to reverse all gains of this second leg of pullback.
The top of 2019 at $14k could fortify this support. The round number and psychologically important level of $10k could be the strongest support among those mentioned here.
Let us move on to the chart of the second largest coin, Ethereum.
This time I switched to a Weekly time frame as I spotted another pattern for this coin - in the daily chart it has the same Bearish Divergence on the RSI sub-chart as Bitcoin does.
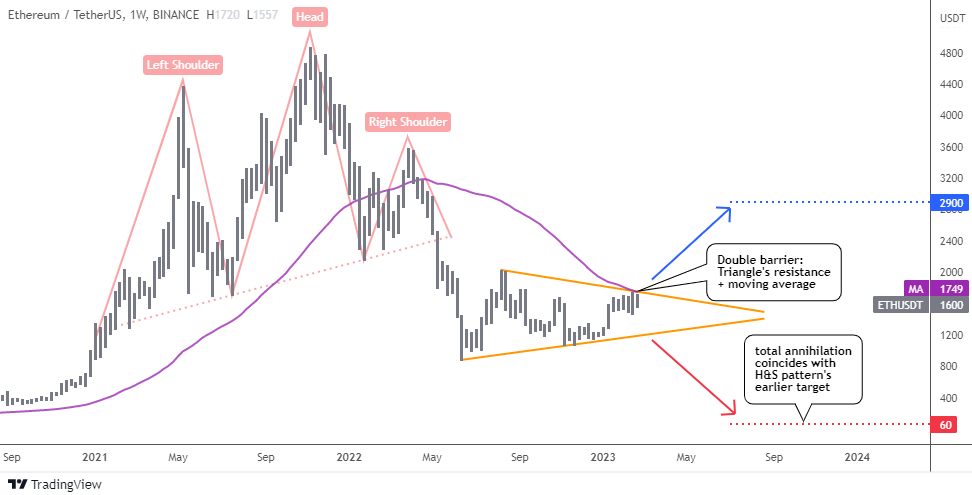
The combination of rising valleys and falling peaks has shaped a well-known Triangle pattern (orange).
The upside target for the pattern is located at the distance of the widest part of Triangle added to the breakup point at $2,900.
In the middle of the month, the price has failed to pass through the double barrier at $1,750 consisting of purple moving average and the pattern’s upper trendline.
If price fails to crack the resistance, the following drop should break below the downside of the Triangle around $1,200.
The bearish target is located at $60, which means almost total annihilation of Ethereum. This is the second pattern that signals the same target as outlined in my post titled “Crypto Apocalypse?” last May.
That time, the Bearish reversal Head & Shoulders pattern was forming. I added it in pink to the current chart above as a reminder.
Intelligent trades!
Aibek Burabayev
INO.com Contributor
Disclosure: This contributor has no positions in any stocks mentioned in this article. This article is the opinion of the contributor themselves. The above is a matter of opinion provided for general information purposes only and is not intended as investment advice. This contributor is not receiving compensation (other than from INO.com) for their opinion.
Dear Ms. Evans, thanks for taking time to share your thoughts.
Best regards, Aibek
All of the above, the market is going down and all boats sink!
Linda
Crypto is so low now, this is the right moment to buy
Dear Dirk, thank you for stopping by and sharing your opinion.
Let’s live and see.
Best wishes, Aibek