On the 24th of July, silver had reached the target of $16.6, which I had set in June when the price was at $14.55. It finished that move way ahead of time as the time target; Now on the 2nd of September. It took the poor man’s gold only 41 bars to arrive at the destination instead of amazingly equal periods of 69 bars in AB and BC segments.
Quite often silver makes a surprise for the market as it was submissive before and now it lives in the clouds like an eagle outshining the gold.
Let’s see how you had predicted the future of silver in the poll below.

No questions, it was one of the clearest ballots on the blog. The majority with absolute dominance had chosen the success of the bullish move and were right, again! Last time one of the readers expressed his fears about those facts that the majority in the ballots predicts very well so far. Here is more fantastic proof! Maybe this is what we call the power of the Hive Mind (Collective Intelligence).
What’s next?
In January, I shared with you two silver charts with different clones. “Echo Of The 80s' was based on the distant clone of the past century, and the recent model used the earlier move up as a sample. The 80’s implied lingering silver weakness and the earlier model required a very sharp bullish move. Silver had chosen none of these models and built the new path.
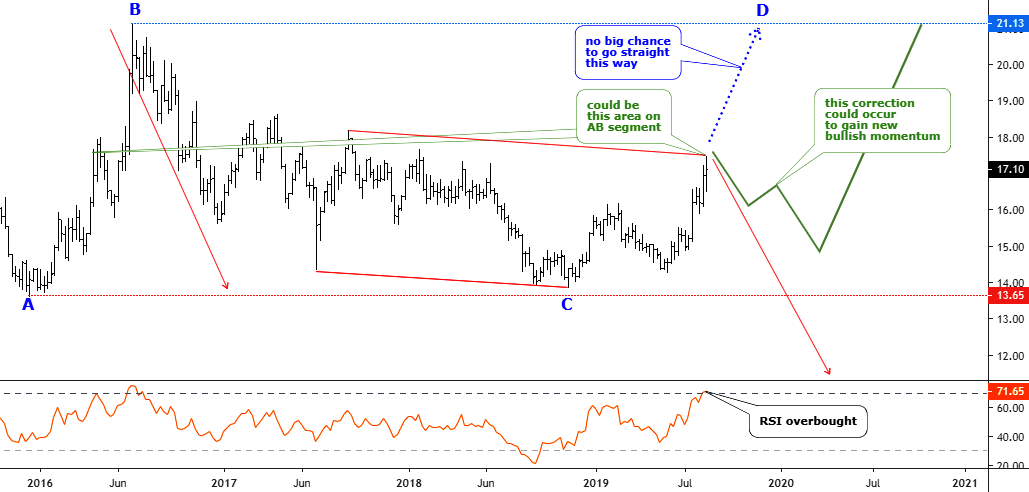
Let’s look at the updated weekly chart below to see what happens now and where could be the next move.

Chart courtesy of tradingview.com
As the topic’s title says, I see three possible options where silver could go. For visual distinction, I labeled them with three different colors: blue is optimistic, green is conservative, and the red is pessimistic.
Let’s start with the optimistic (blue) scenario. This idea is not new as I posted it for the first time for gold and silver more than two years ago in July of 2017 right after the “Flash Crash” in the silver market. This scenario implies that the silver should complete the AB/CD structure of a large complex correction to hit the $21 area. As soon as gold is above $1400 it is still possible, but in my mind, there is no big chance for it as RSI is already overbought and the gold is struggling to retest the $1577 area of the next target. So, the bullish impulse could be limited as it is a quite long way to go as we hardly could cross the middle of the route.
The green labels show the conservative way as you could compare the progress of the AB segment with the current move up. According to history, there is one more move up is pending to refresh the current top of $17.51, and then the correction should follow. The overbought RSI had also been there like these days. This scenario implies that the silver should go to a pit-stop to gain new bullish momentum for another rally.
The pessimistic red labeling shows us that the notorious “Flash Crash” had just completed the first leg of the move down (left down arrow). The area between the valley of 2017 and the current top shapes the large intermediate consolidation. Then there could be another drop to retest and even break below the former bottom of $13.65. If gold will complete the large consolidation between $1500 and $1600 and then will drop to retest the $1000, this scenario could be intact.
Please kindly share your opinion in the comments.
Intelligent trades!
Aibek Burabayev
INO.com Contributor, Metals
Disclosure: This contributor has no positions in any stocks mentioned in this article. This article is the opinion of the contributor themselves. The above is a matter of opinion provided for general information purposes only and is not intended as investment advice. This contributor is not receiving compensation (other than from INO.com) for their opinion.

Do you buy silver?
should someone buy silver now or wait, till we see on china
It is in bull grip and fed lowering rate expectation is also contributing.Also dollar position is puzzlling due to trade war.