Gold Stock Correction And Upcoming Opportunity

Before updating the status of the gold miner (HUI) correction, let’s take a quick review of the Macrocosm because it’s always a good time to be clear on important macro considerations.

The graphic makes the following points that are the foundation of the NFTRH view on the right/wrong times to be fundamentally bullish on the gold-stock sector. In order of priority, a bullish view needs:

  • A contracting economy, which…
  • Drives counter-cyclical gold higher vs. stock markets (and many other assets), and…
  • By extension, sees a general decline in economic and market confidence.
  • When an economic boom phase ends, yield curves bottom and start to steepen.
  • Gold rises vs. commodities and materials, some of which represent mining costs.
  • Gold rises vs. all major currencies, which is also a sign of declining systemic confidence.
  • Inflation expectations can be constructive for gold and especially silver, which drives ‘inflationist’ bugs into gold stocks, but this is not fundamentally positive if the inflation is cyclical and drives commodities like energy and materials more than gold. This is when gold stocks rise against their proper fundamentals. *
  • Cyclical inflation, as in 2003-2008 can see the sector rise strongly (HUI was approximately +300% in that period) but the end will be bloody, as per the Q4 2008 sector cleanout.
  • China/India “love trade”: Hahaha… when you see this in writing, run away from it.

Continue reading "Gold Stock Correction And Upcoming Opportunity"

Silver Update: This Setback Could Be A Takeoff Roll

Earlier this August, I shared with you the map for silver with three possible options of how the price could emerge. I labeled them with three different colors for you to distinguish them easily.

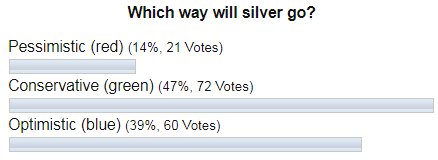
Let’s see below how did you vote for the future of the silver price.

Silver Poll

I didn’t doubt that the “Pessimistic” (red) scenario would be the least liked option as silver bears are rare these days amid the powerful bullish move in the metal’s price, that had preceded the ballot. The polar “Optimistic” (blue) scenario, which implied the non-stop move of the silver price to the upside to tag the former top of $21.13, ranked second. Indeed, it was a close call as the poor man's gold, surprisingly rocketed in a week after the post to hit the multi-year maximum at the $19.65. It could be a winning stake, but right after that the price dropped hard to close the first week of September below $18. And here comes the accurate prediction, that was picked by the majority as you had chosen the “Conservative” (green) scenario, which implied the setback of the price ahead of the final home run. Again, it was an amazingly prophetic call, thanks for sharing your votes with all of us here on the Blog.

I updated the map for you in the weekly silver chart below, let’s have a look there. Continue reading "Silver Update: This Setback Could Be A Takeoff Roll"

Silver Smashed The Target Early; Now I See 3 Options

On the 24th of July, silver had reached the target of $16.6, which I had set in June when the price was at $14.55. It finished that move way ahead of time as the time target; Now on the 2nd of September. It took the poor man’s gold only 41 bars to arrive at the destination instead of amazingly equal periods of 69 bars in AB and BC segments.

Quite often silver makes a surprise for the market as it was submissive before and now it lives in the clouds like an eagle outshining the gold.

Let’s see how you had predicted the future of silver in the poll below.

Silver

No questions, it was one of the clearest ballots on the blog. The majority with absolute dominance had chosen the success of the bullish move and were right, again! Last time one of the readers expressed his fears about those facts that the majority in the ballots predicts very well so far. Here is more fantastic proof! Maybe this is what we call the power of the Hive Mind (Collective Intelligence).

What’s next? Continue reading "Silver Smashed The Target Early; Now I See 3 Options"

Gold Takes Off, Silver To Follow?

In the middle of May, I questioned if the Head & Shoulders pattern, that was detected in April was still intact. Most of you agreed that there was enough evidence to drop that bearish idea, moreover, the new Bull Flag pattern was spotted on the weekly master chart.

Besides that, one of the readers kindly enriched our view, noticing another bullish Cup & Handel pattern that supported the upside expectation.

Last Friday, the gold took off its upside journey as the Bull Flag was breached to the North as price finally moved beyond the $1300 handle and overcame the minor top established on the 14th of May. The targets were set before, let’s hope for the best!

But what about silver? Last time I wrote about it in January using experimental clones from history. This metal had an ugly chart structure as gold had a clearer one. But no matter how the market tries to confuse us sooner or later we will see the end anyway. Again silver has been a laggard behind gold, and the latter gives us a clue as it broke up the resistance.

Let’s see, in the chart below if we can find gold’s shining in the silver market. Continue reading "Gold Takes Off, Silver To Follow?"

Will Oil Find Support Near $60?

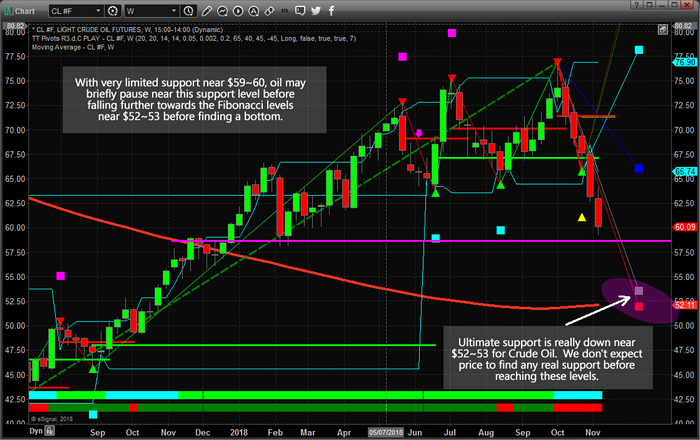
Our research team warned of this move in Crude Oil back on October 7, 2018. At that time, we cautioned that Oil may follow a historical price pattern, moving dramatically lower and that lows near $65 may become the ultimate bottom for that move. Here we are with a price below that level, and many are asking “where will it go from here?”.

We believe the support near $65, although clearly broken, may eventually become resistance for a future upside price move. Our proprietary Fibonacci price modeling system is suggesting a new target near $52~53, and we believe this downside move in Oil is far from over at this point.

global climate

The current global climate for Oil is that suppliers are pumping more and more oil into the market at a time when, historically, prices should continue to decline. One of our research tools includes the ability to identify overall bias models for each week, month or quarter. Traditionally, Oil is dramatically weaker in November and relatively flat for December. Continue reading "Will Oil Find Support Near $60?"