There is a quote from my post in November of 2020 - "Silver could spoil this party where the stars aligned for DXY and gold." I've meant that the uncompleted chart structure in the silver graph could signal a more complex correction despite the bullish move as it was just the junction between larger downside moves. These words turned prophetic as a poisoned silver arrow hit precious metals badly last week.
Hold on tight; the roller-coaster ride carries on.
Let us start with the silver chart below, and you will see why I chose it to be the first.
You saw this chart a month ago when I was questioning "Could Santa Only Visit Gold?" as I doubted the non-stop rocket move for silver.
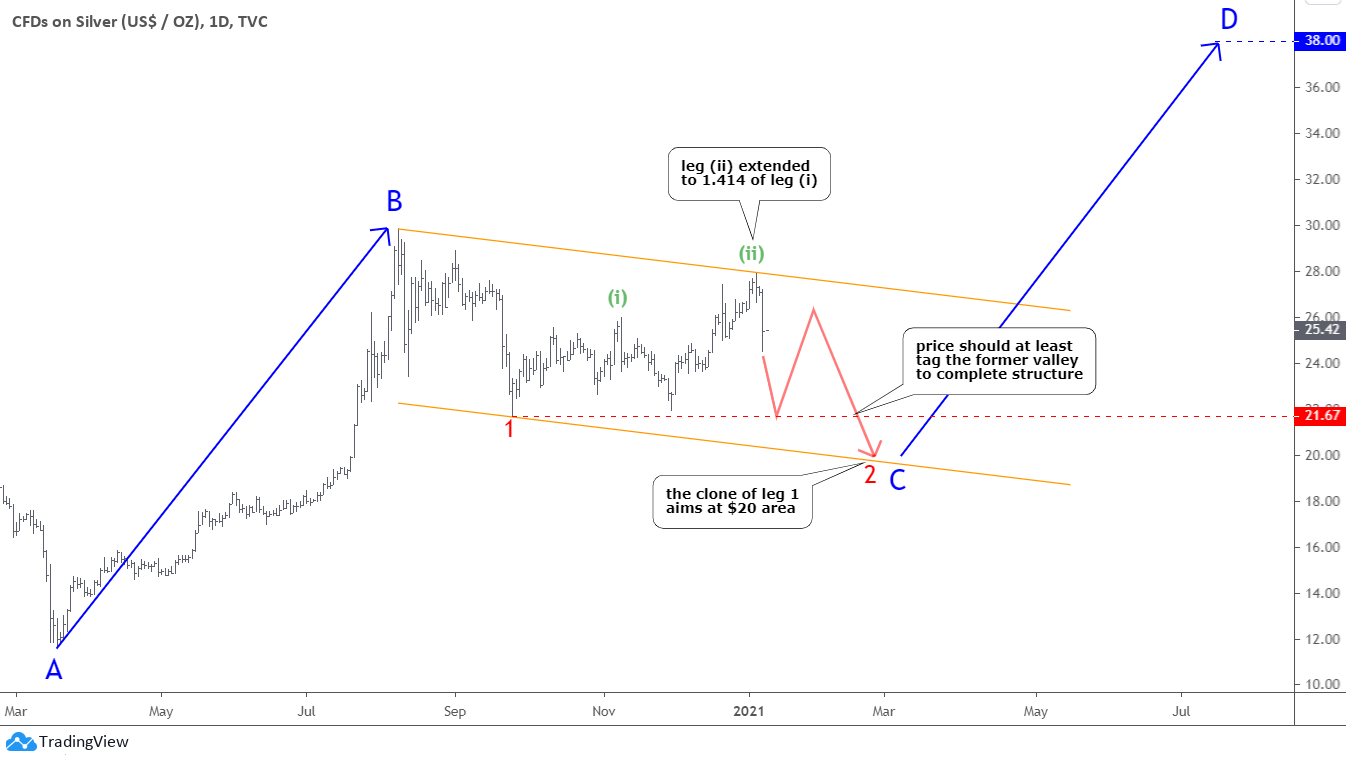
It is the exact same chart with an updated price graph. The green leg (ii) of the joint moved exactly as projected in December. It just traveled a longer distance equal to 1.414 of the green leg (i). That is why I turned the orange trend channel higher.
3 Proft Triggers for Cannabis Stocks in 2021
Ater falling sharply in 2019, the sector was hit hard again in the spring when COVID-19 ravaged global markets. Cannabis stocks and sentiment hit a multi-year low, and many cannabis investors threw in the towel.
But cannabis stocks followed a pattern like we've seen many times before on Wall Street. Extreme pessimism sets the stage for an enormous rally. The rally may continue after boosts from three big events in 2021
I cloned the preceding red leg 1 to build the second red leg to the downside with the red zigzag aiming in the area of $20. Now, it should at least tag the former valley of $21.67 that has been missed in November. This could be enough to complete the entire corrective phase and continue to the upside.
The blue C point is yet to be established. The initial target for a new blue CD segment based on the projected downside target area of red leg two is around $38. I will adjust it later.
Gold indeed puzzled me as I was weighing all visible factors, including a bouncing dollar, a plummeting silver, a rocketing Bitcoin, and rising ten-year yields. I can see three possible scenarios now.
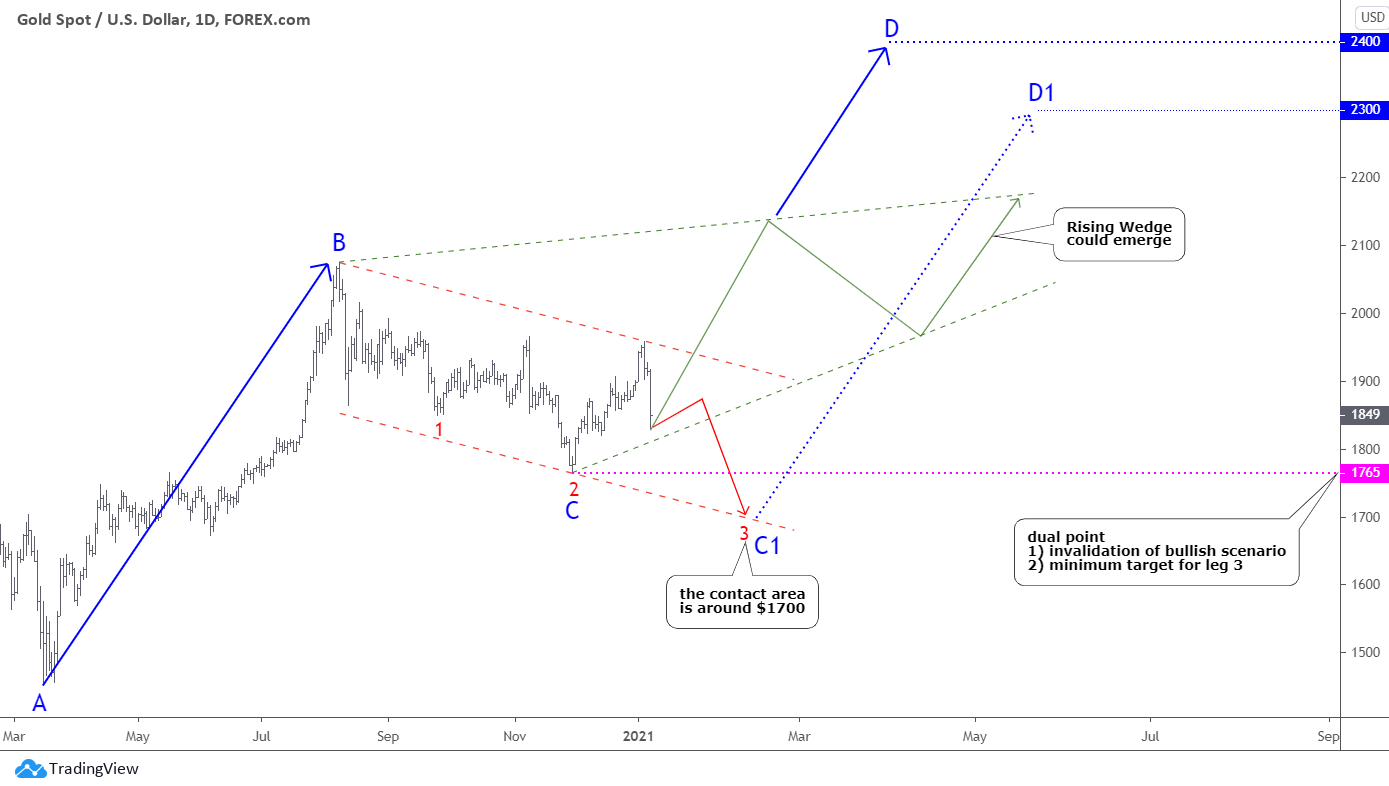
As long as gold is above the invalidation point of $1765, we can consider the recent drop as a retracement ahead of the next move up within the blue CD segment, which targets the $2400 area. This will contradict the possible reversal of the dollar index, although both instruments could move along amid the safety bid for some time. Something terrible should happen then with the World.
The green annotations mark the possible Rising Wedge pattern, which could appear in the chart. It will complete the move up ahead of either a total reversal or another consolidation. The target then could be limited with wide seesaw moves around $2200.
You've already seen this red path on the silver chart, but here is one difference. The structure is neat as we have two clear legs down, and in the case of another drop, it will be marked as #3. The red zigzag down shows the breakdown as we should see two minor moves to the downside, and the first one could already be over. The minor consolidation should link both legs ahead of the last drop to touch the red dashed channel's downside around $1700. The minimum target for leg 3 is located in the former valley of $1765.
If the red path emerges, then the target to the upside will be moved lower to $2300 as highlighted in the chart above with the C1D1 blue dashed up arrow.
Intelligent trades!
Aibek Burabayev
INO.com Contributor, Metals
Disclosure: This contributor has no positions in any stocks mentioned in this article. This article is the opinion of the contributor themselves. The above is a matter of opinion provided for general information purposes only and is not intended as investment advice. This contributor is not receiving compensation (other than from INO.com) for their opinion.


