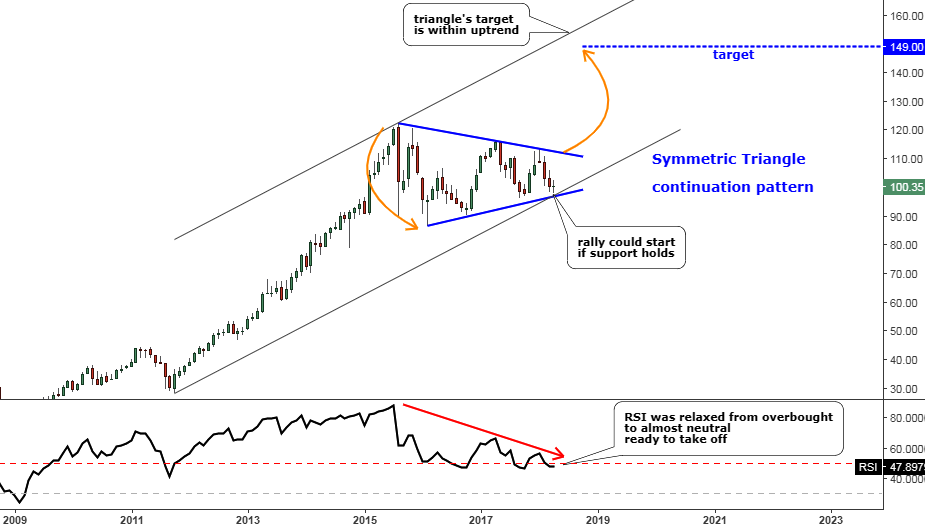
In April 2018, I published the post with the title “Disney Could Rally After A Long Pause”. I spotted an interesting long setup on the Disney (DIS) chart that time. Below is that monthly chart of Disney stock with the bullish setup.
The combination of higher tops and higher lows has shaped the famous Triangle (Symmetric) pattern highlighted in blue.
The neutral position of the relaxed RSI indicator and the double trendline support on the chart facilitated the bullish opportunity. The target was set at the equal distance of the widest part of the pattern added to the breakout point. It was located at $149 with a potential gain of 50% as the stock was traded around $100.
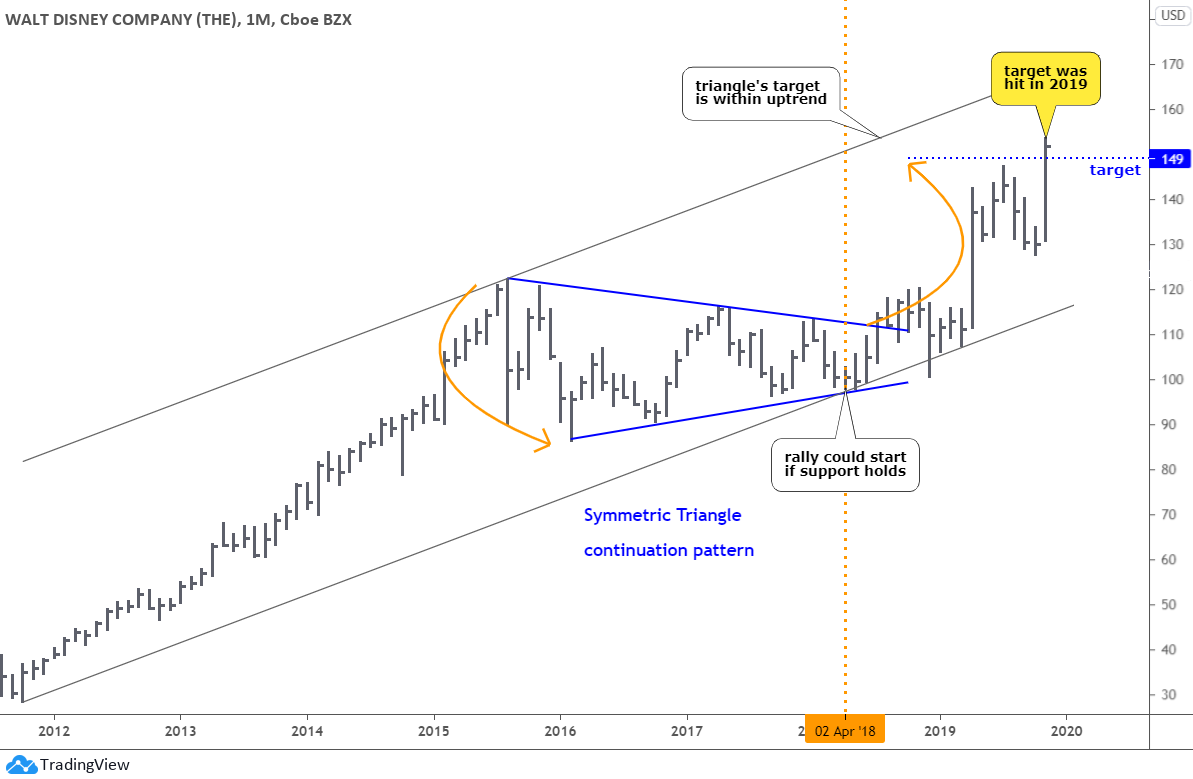
We can see how it played out in the next chart.
The orange vertical line divides the chart above into two parts – “before” and “after.” We can see that the price indeed reversed to the upside right from the double trendline support and finally hit the target in November of 2019.
The majority of you voted for this buying opportunity above, and I hope you enjoyed this profitable journey.
The stars aligned in the same way in the Amazon (AMZN) daily chart below, so let me share it with you.
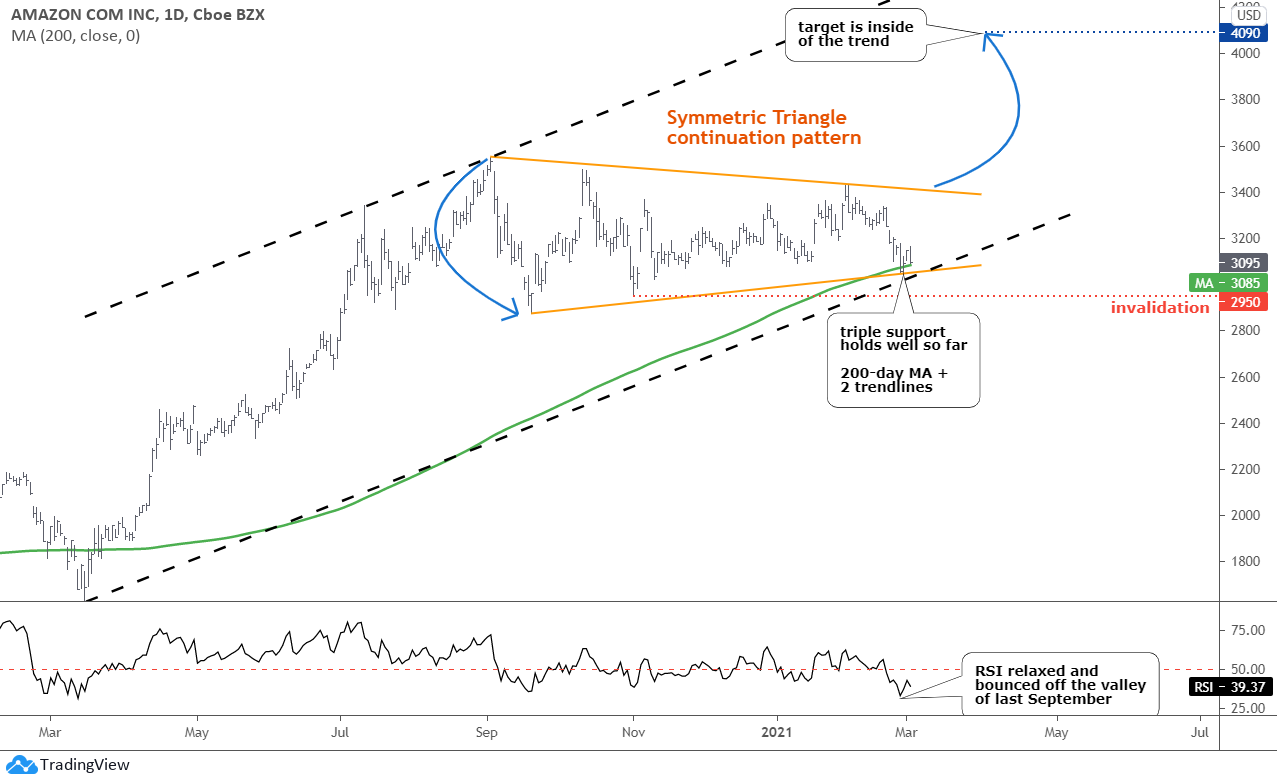
Amazon’s stock price moved up non-stop from the $1626 low established last March until it has established the all-time high record of $3552 last September. The price more than doubled, then. It reached the upside of the black dashed uptrend channel built through the valley of March 2020 and the top of July 2020.
Free Expertly-Researched Stock Pick Delivered Every Week!
Our experienced analyst carefully scours financial publications, balance sheets, press releases, charts, live events, and more to locate the most liquid, undervalued, and overlooked stocks.
The stock price could not break that resistance, and then it collapsed rapidly before it could find demand in the $2871 area. The Amazon price lost almost $700 then that was huge. Right after that, the price has shown the series of seesaw moves in opposite directions within the familiar pattern of falling peaks and rising troughs. I contoured it with the orange converging trendlines to build the Symmetric Triangle continuation pattern.
This time, I also added the 200-day Moving Average indicator (green) to highlight the possible additional support for Amazon stock price. This idea indeed paid well, as we can see how it fortified the already strong double support of two trendlines (orange and black). The recent drop already attacked that area, and the triple support holds well so far.
The consolidation within the orange pattern looks big enough compared to the preceding uptrend. The price approaches the apex of the Triangle, and it bounced off the support. This could offer a good buying opportunity as we witnessed how it worked on the Disney chart before.
The target is set at the distance of the widest part of the pattern ($681) added to the breakout point ($3409) and is equal to $4090. It’s a 32% gain, and it could be a good bet, as the risk/reward ratio is at a very high level of 6.86 if one would quit the trade once the price sinks below the previous low of $2950 (red invalidation trigger).
The target is within the uptrend, and it is a good sign of a conservative goal. Another supporting factor is that the RSI relaxed heavily and bounced off the last September’s valley; now it has enough room for another rally.
The main difference with the Disney chart is the time frame. The Amazon (AMZN) setup was built on the daily chart, and it should play out faster than Disney did as the latter was built on the long-term monthly chart.
Intelligent trades!
Aibek Burabayev
INO.com Contributor, Metals
Disclosure: This contributor has no positions in any stocks mentioned in this article. This article is the opinion of the contributor themselves. The above is a matter of opinion provided for general information purposes only and is not intended as investment advice. This contributor is not receiving compensation (other than from INO.com) for their opinion.


