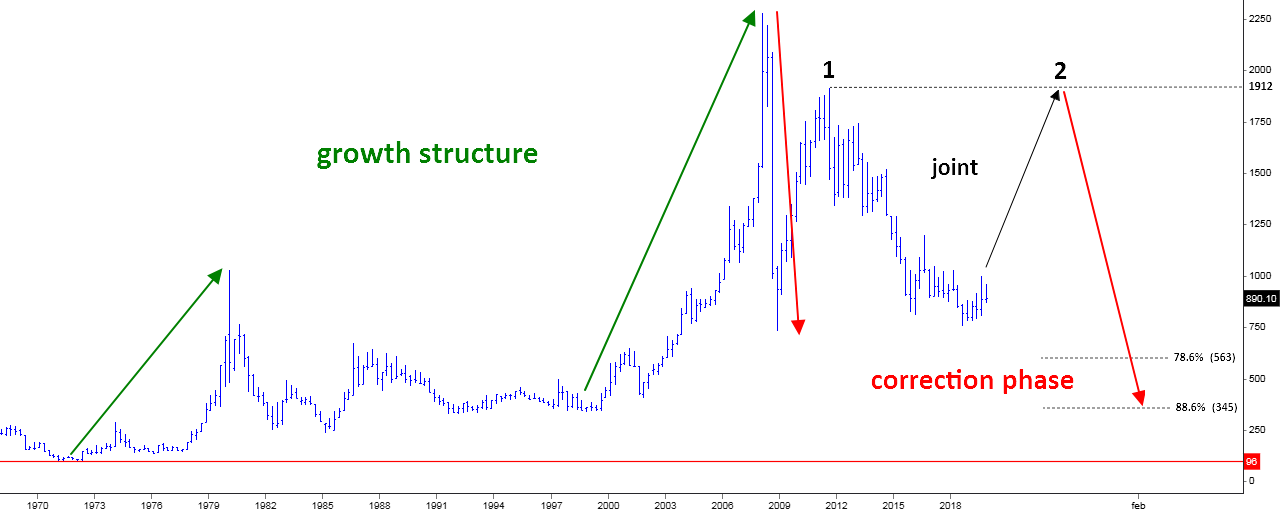
I put the platinum first as it has a clearer structure. The big map has remained unchanged since 2019; I put it down below to brush up.
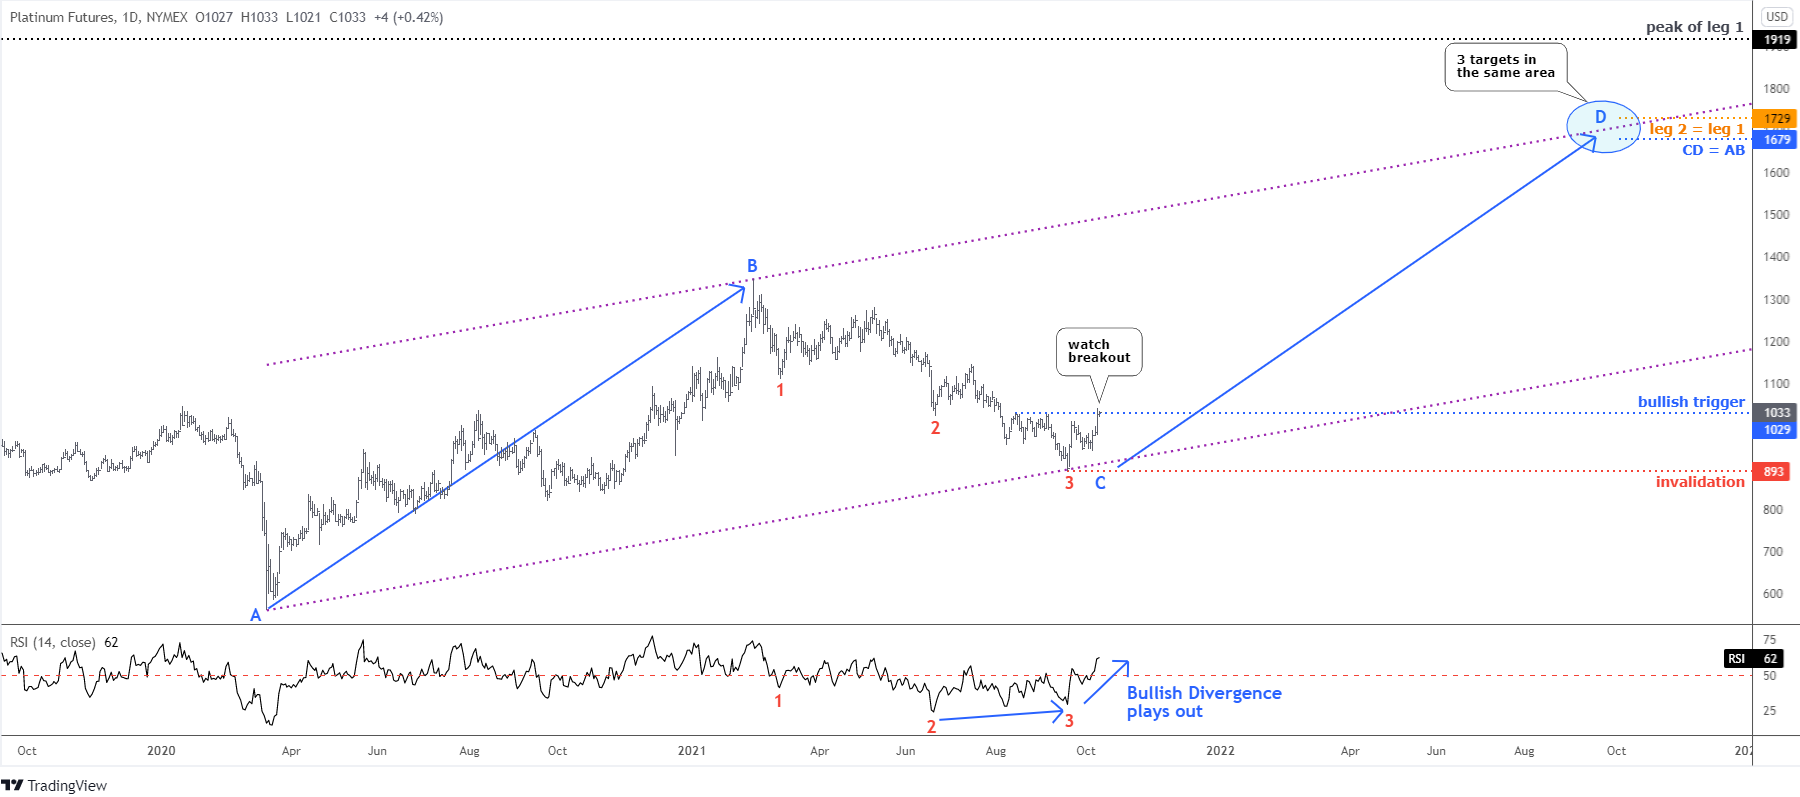
We are in leg 2 (black) with a completed AB part (next chart). I expected the CD part to start earlier. However, the bullish trigger was left untouched and the market collapsed further down.
The third red leg down has hammered the platinum futures price below $1,000 handle to hit the valley in $893. It is amazing how symmetry works here, as all three legs are almost equal to each other. It is a good sign for the platinum as it suffered a lot.
Another positive signal has come from the RSI. This powerful indicator has shown a Bullish Divergence as the lower valley of leg 3 down was not confirmed by the RSI, which had a higher reading. We already can see how this mismatch pushed both the price and the indicator to the upside as the Bullish Divergence plays out. The RSI crossed the crucial 50 level to the upside into a bullish area. This should support the price.
The top of the joint between two minor legs down within the red leg 3 at $1,029 could be a bullish trigger as it eliminates the probability of the third minor leg down in the large leg 3. The price sits right there as we need to see the clear breakout. The invalidation level is located at the bottom of leg 3 at $893.
The C point shifted lower, and so did the D target. If the price would travel the size of the AB part, then the target will hit $1,679. It could be a decent gain with an awesome risk/reward ratio of 4.78.
The orange target where leg 2 is equal to leg 1 is unchanged and located higher at $1,729. I built the purple uptrend through the A, B, and C points. The upside is aimed at the same area as the two above-mentioned targets, around $1,700. This coincidence fortifies the target area.
The ultimate point that the emerging big structure could reach is the top of leg 1 at $1,919. Leg 2 should travel more than leg 1, then.
The Symmetric Triangle pattern spotted in July in the palladium futures chart was so promising. However, the bullish trigger was not activated. Later, the setup was invalidated as the price dropped below the growth point under the $2,264.
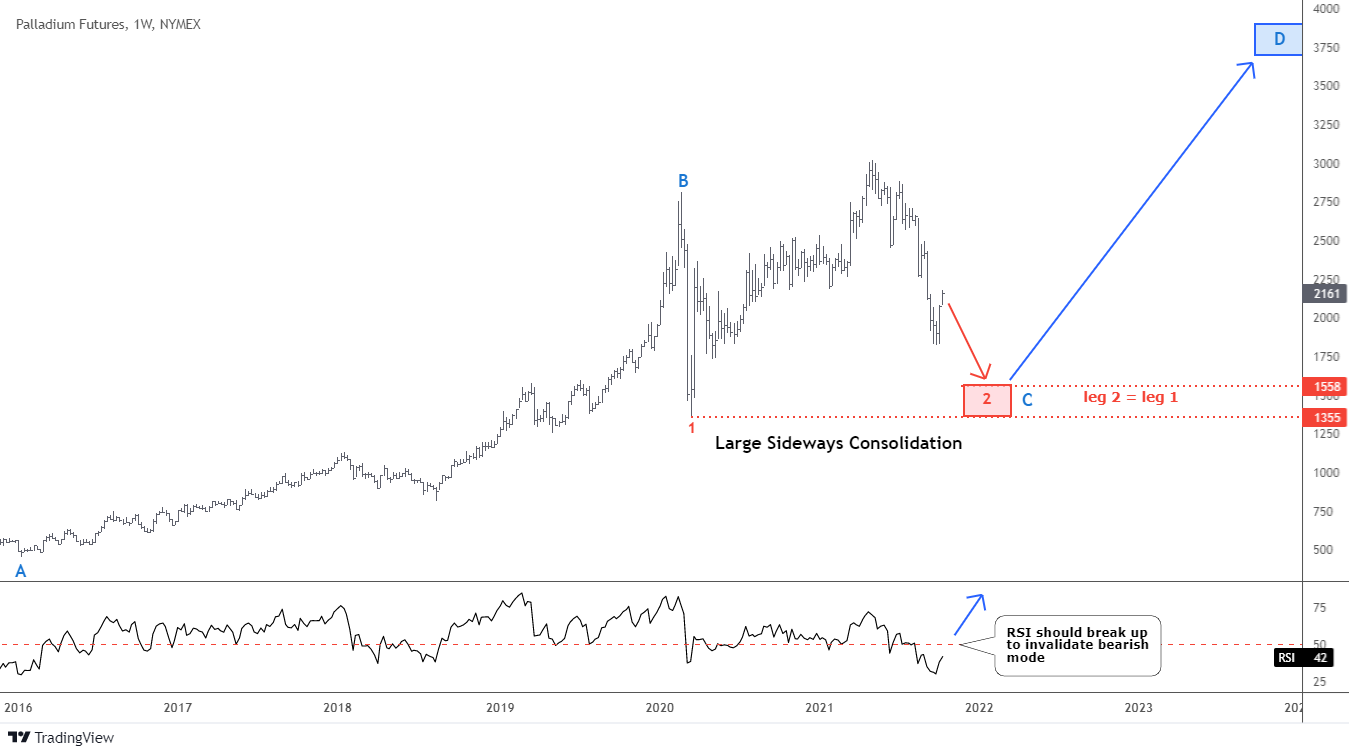
The corrective structure unfolds as a Large Sideways Consolidation. We could spot two large legs down. This is what the market needs to take a pause after a strong rally within an AB part lasted for four years. In February 2022, the current consolidation turns two years or half of its time in the AB part.
The corrective models are tricky by nature, and this game down could stop anytime, if not already. I would prefer to see leg 2 reach at least the $1,558 where it will travel an equal distance with leg 1 down to start considering it a completed structure. Then, the retest of the valley of leg 1 at $1,355 would be even more reliable.
The current run to the upside is yet to confirm the reversal. We should see the next move to judge whether it is just a pullback or not. The RSI is still under the water, and we should wait for the clear breakout to the upside there.
The target will be set lower than in the earlier update as the C point is obviously much lower. The preliminary computations based on the C point located between $1,355 and $1,558 (red rectangle) project the target in the blue rectangle area between $3,700 and $3,900.
Intelligent trades!
Aibek Burabayev
INO.com Contributor, Metals
Disclosure: This contributor has no positions in any stocks mentioned in this article. This article is the opinion of the contributor themselves. The above is a matter of opinion provided for general information purposes only and is not intended as investment advice. This contributor is not receiving compensation (other than from INO.com) for their opinion.


