Editor’s Note: I will be speaking at an upcoming conference The Vancouver Resource Investment Conference in British Columbia on May 17 and 18. For more information please click the link above.
Gold opened at $1977 on Monday, April 18, and this would mark the beginning of four consecutive weekly declines. As of 5:10 PM EDT gold futures basis, the most active June 2022 Comex contract is fixed at $1810.30 after factoring in today’s decline of $14.30 or 0.78%. Today’s decline in gold occurred without the benefit of dollar strength. The dollar index declined by 0.36% and is currently fixed at 104.515
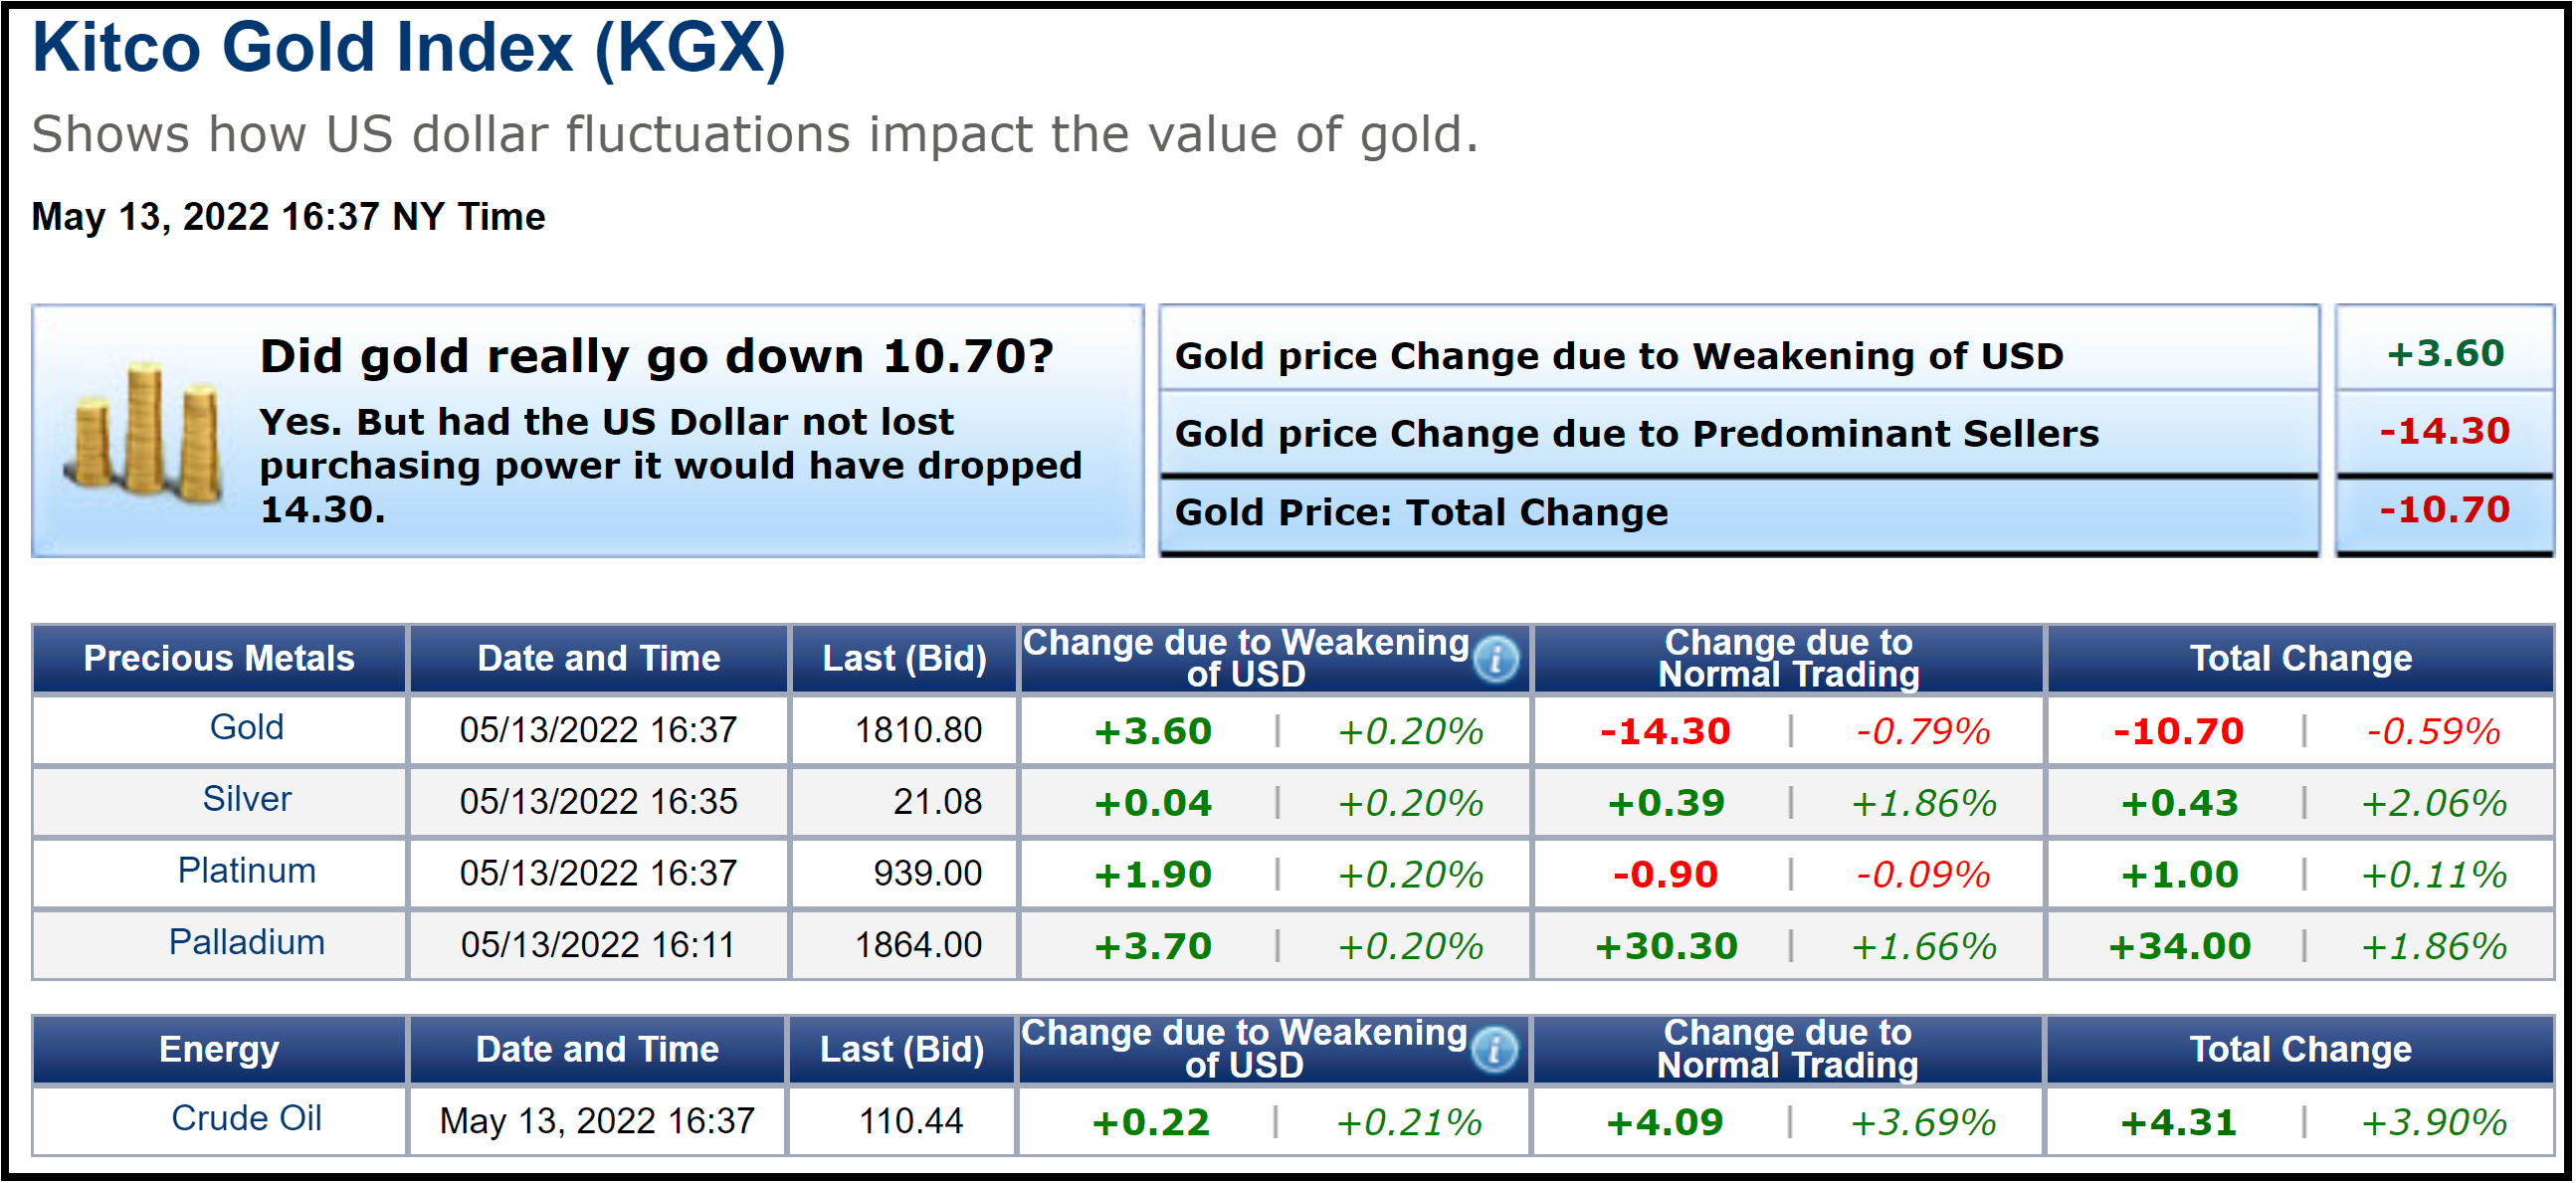
The image above is a screen-print of the KGX (Kitco Gold Index) which was taken at 4:37 PM EDT. At that time spot gold was fixed at $1810.80 after factoring in a decline of $10.70. Market participants were active sellers resulting in a $14.30 price decline. Dollar weakness provided mild tailwinds adding $3.60 (+0.20%) in value.
The decline this week was the strongest percentage drawdown of the four weeks losing 3.87%. Considering that over the last four weeks gold’s value has decreased by 8.44%, almost half of that decline occurred this week. This correction devalued the price of gold by $167 per ounce, with $73 of that decline occurring this week.
Over the last four weeks, a major factor pressuring gold prices lower has been dollar strength. The dollar has gained value for the last six consecutive weeks. Over the last four trading weeks, the U.S. dollar has gained 4.15% in value. This means that dollar strength accounted for just under one-half of gold’s price decline.
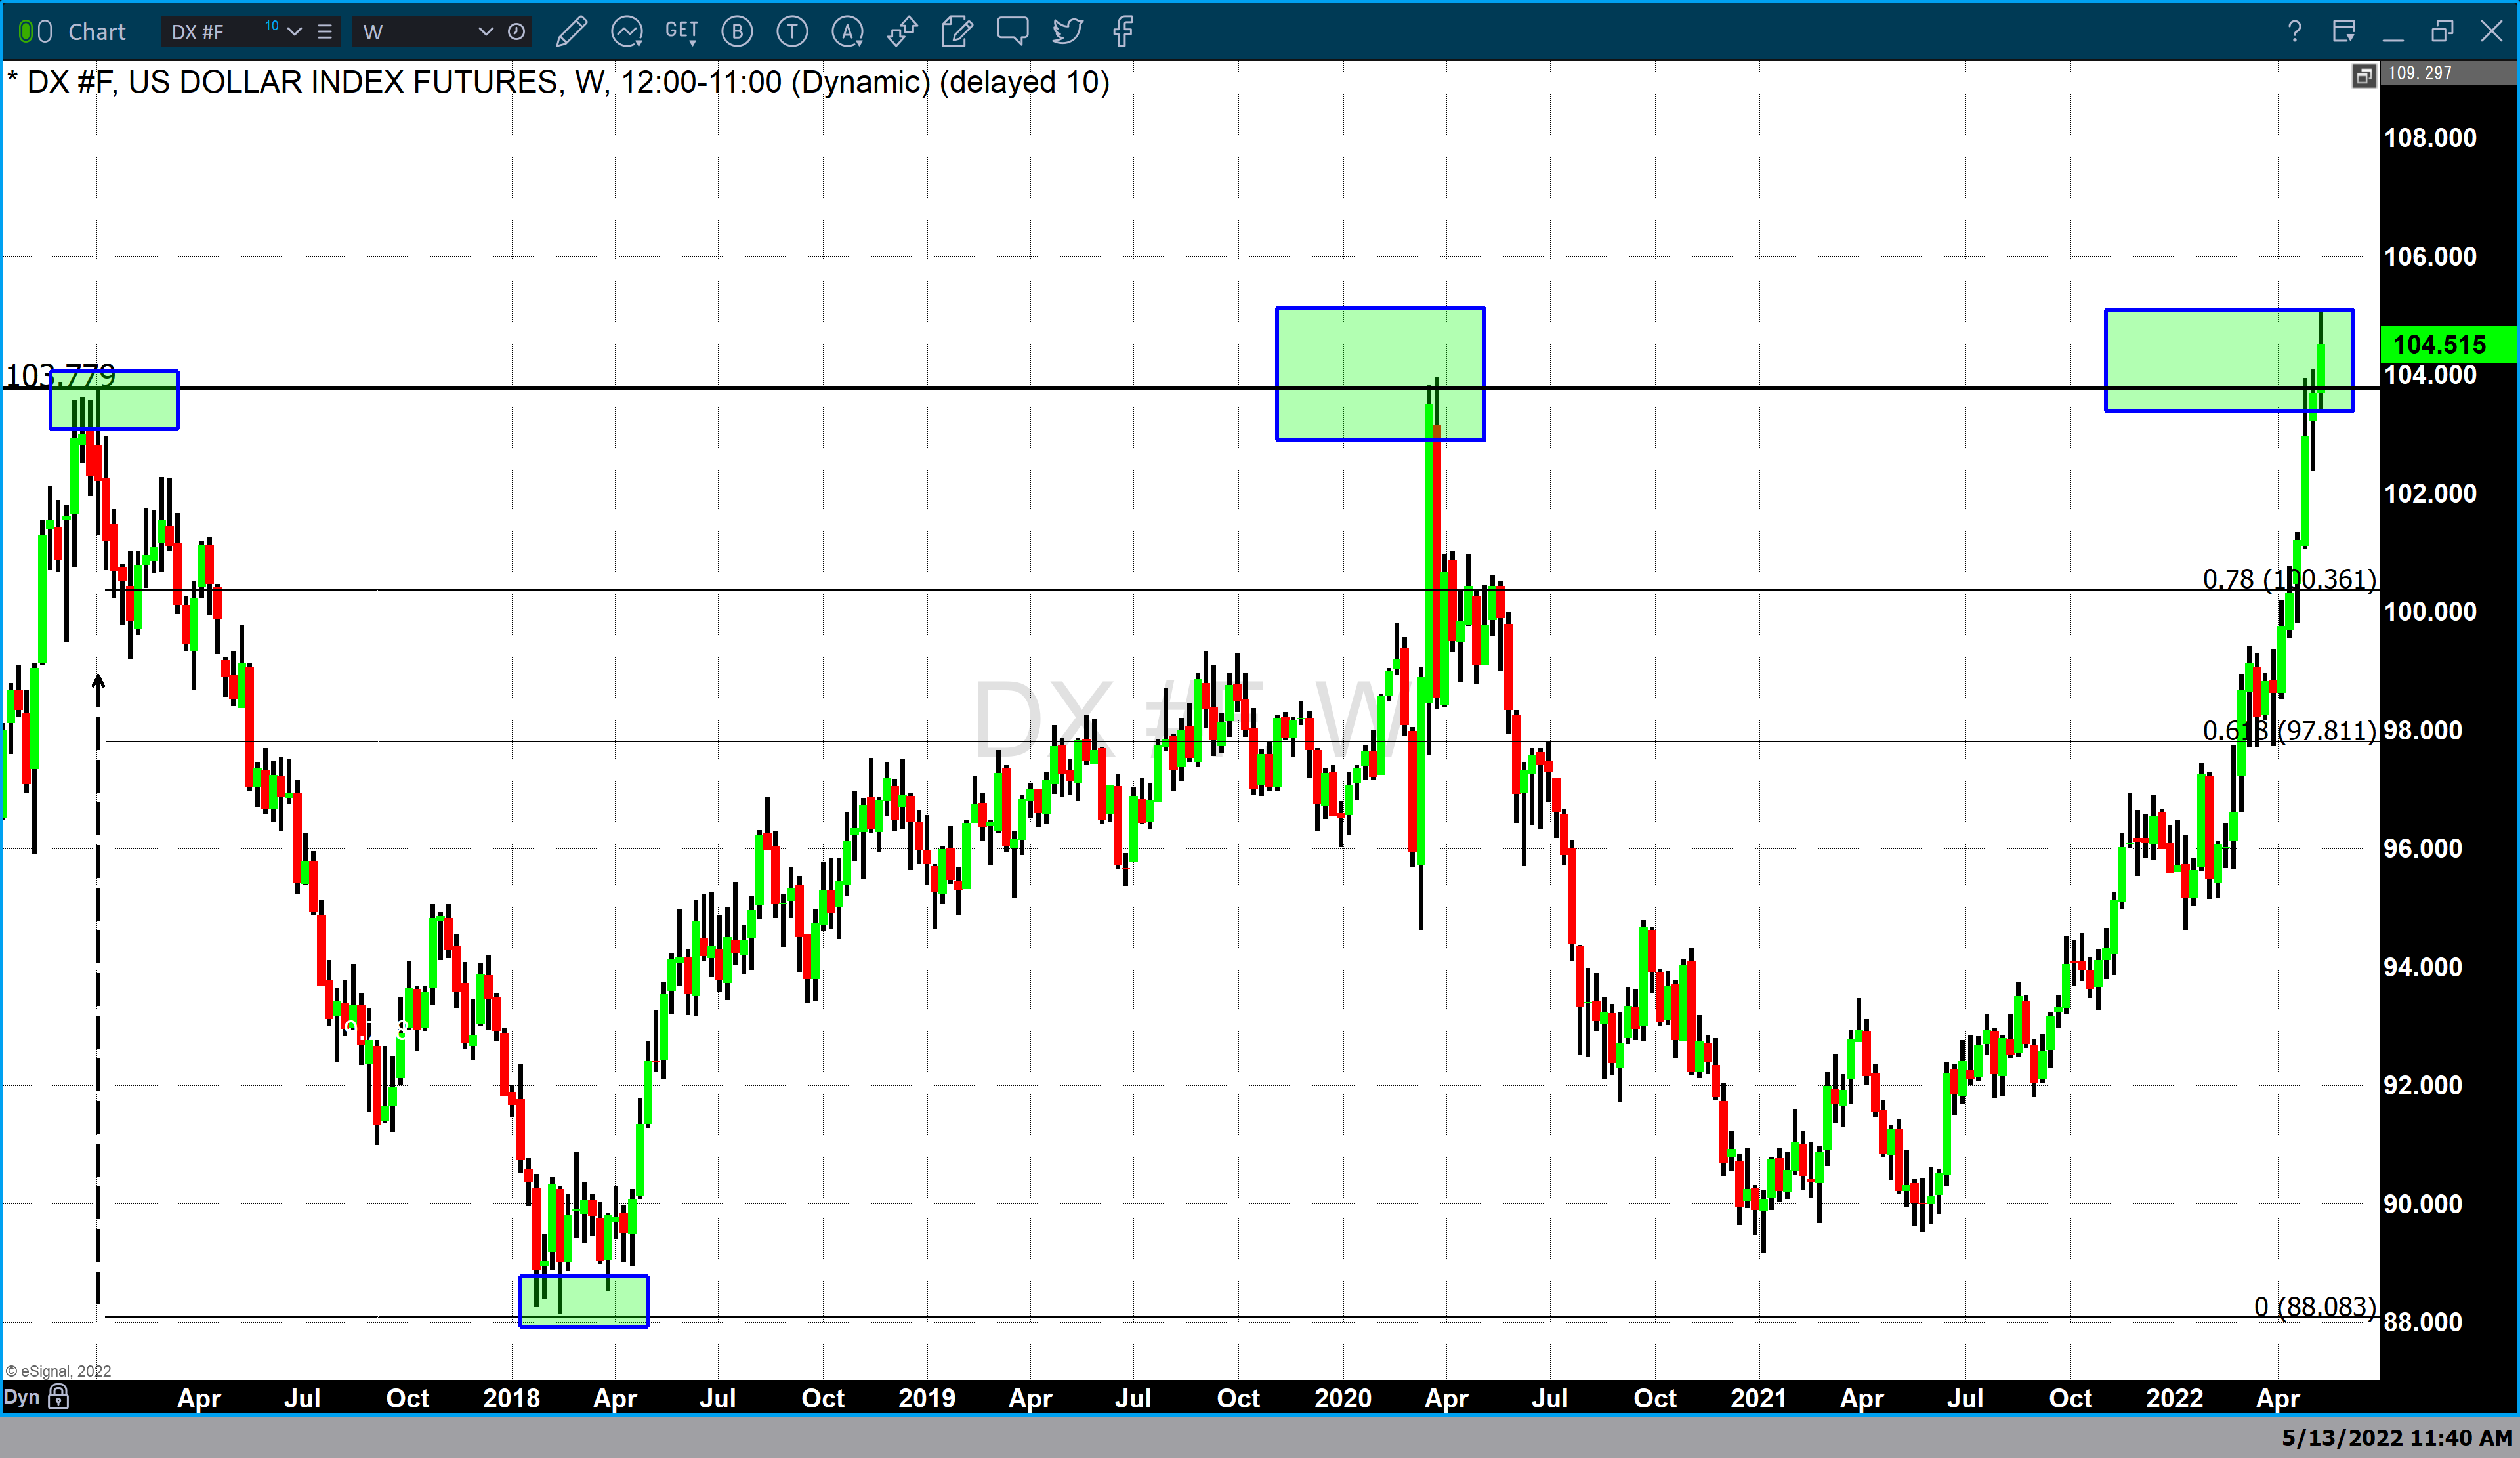
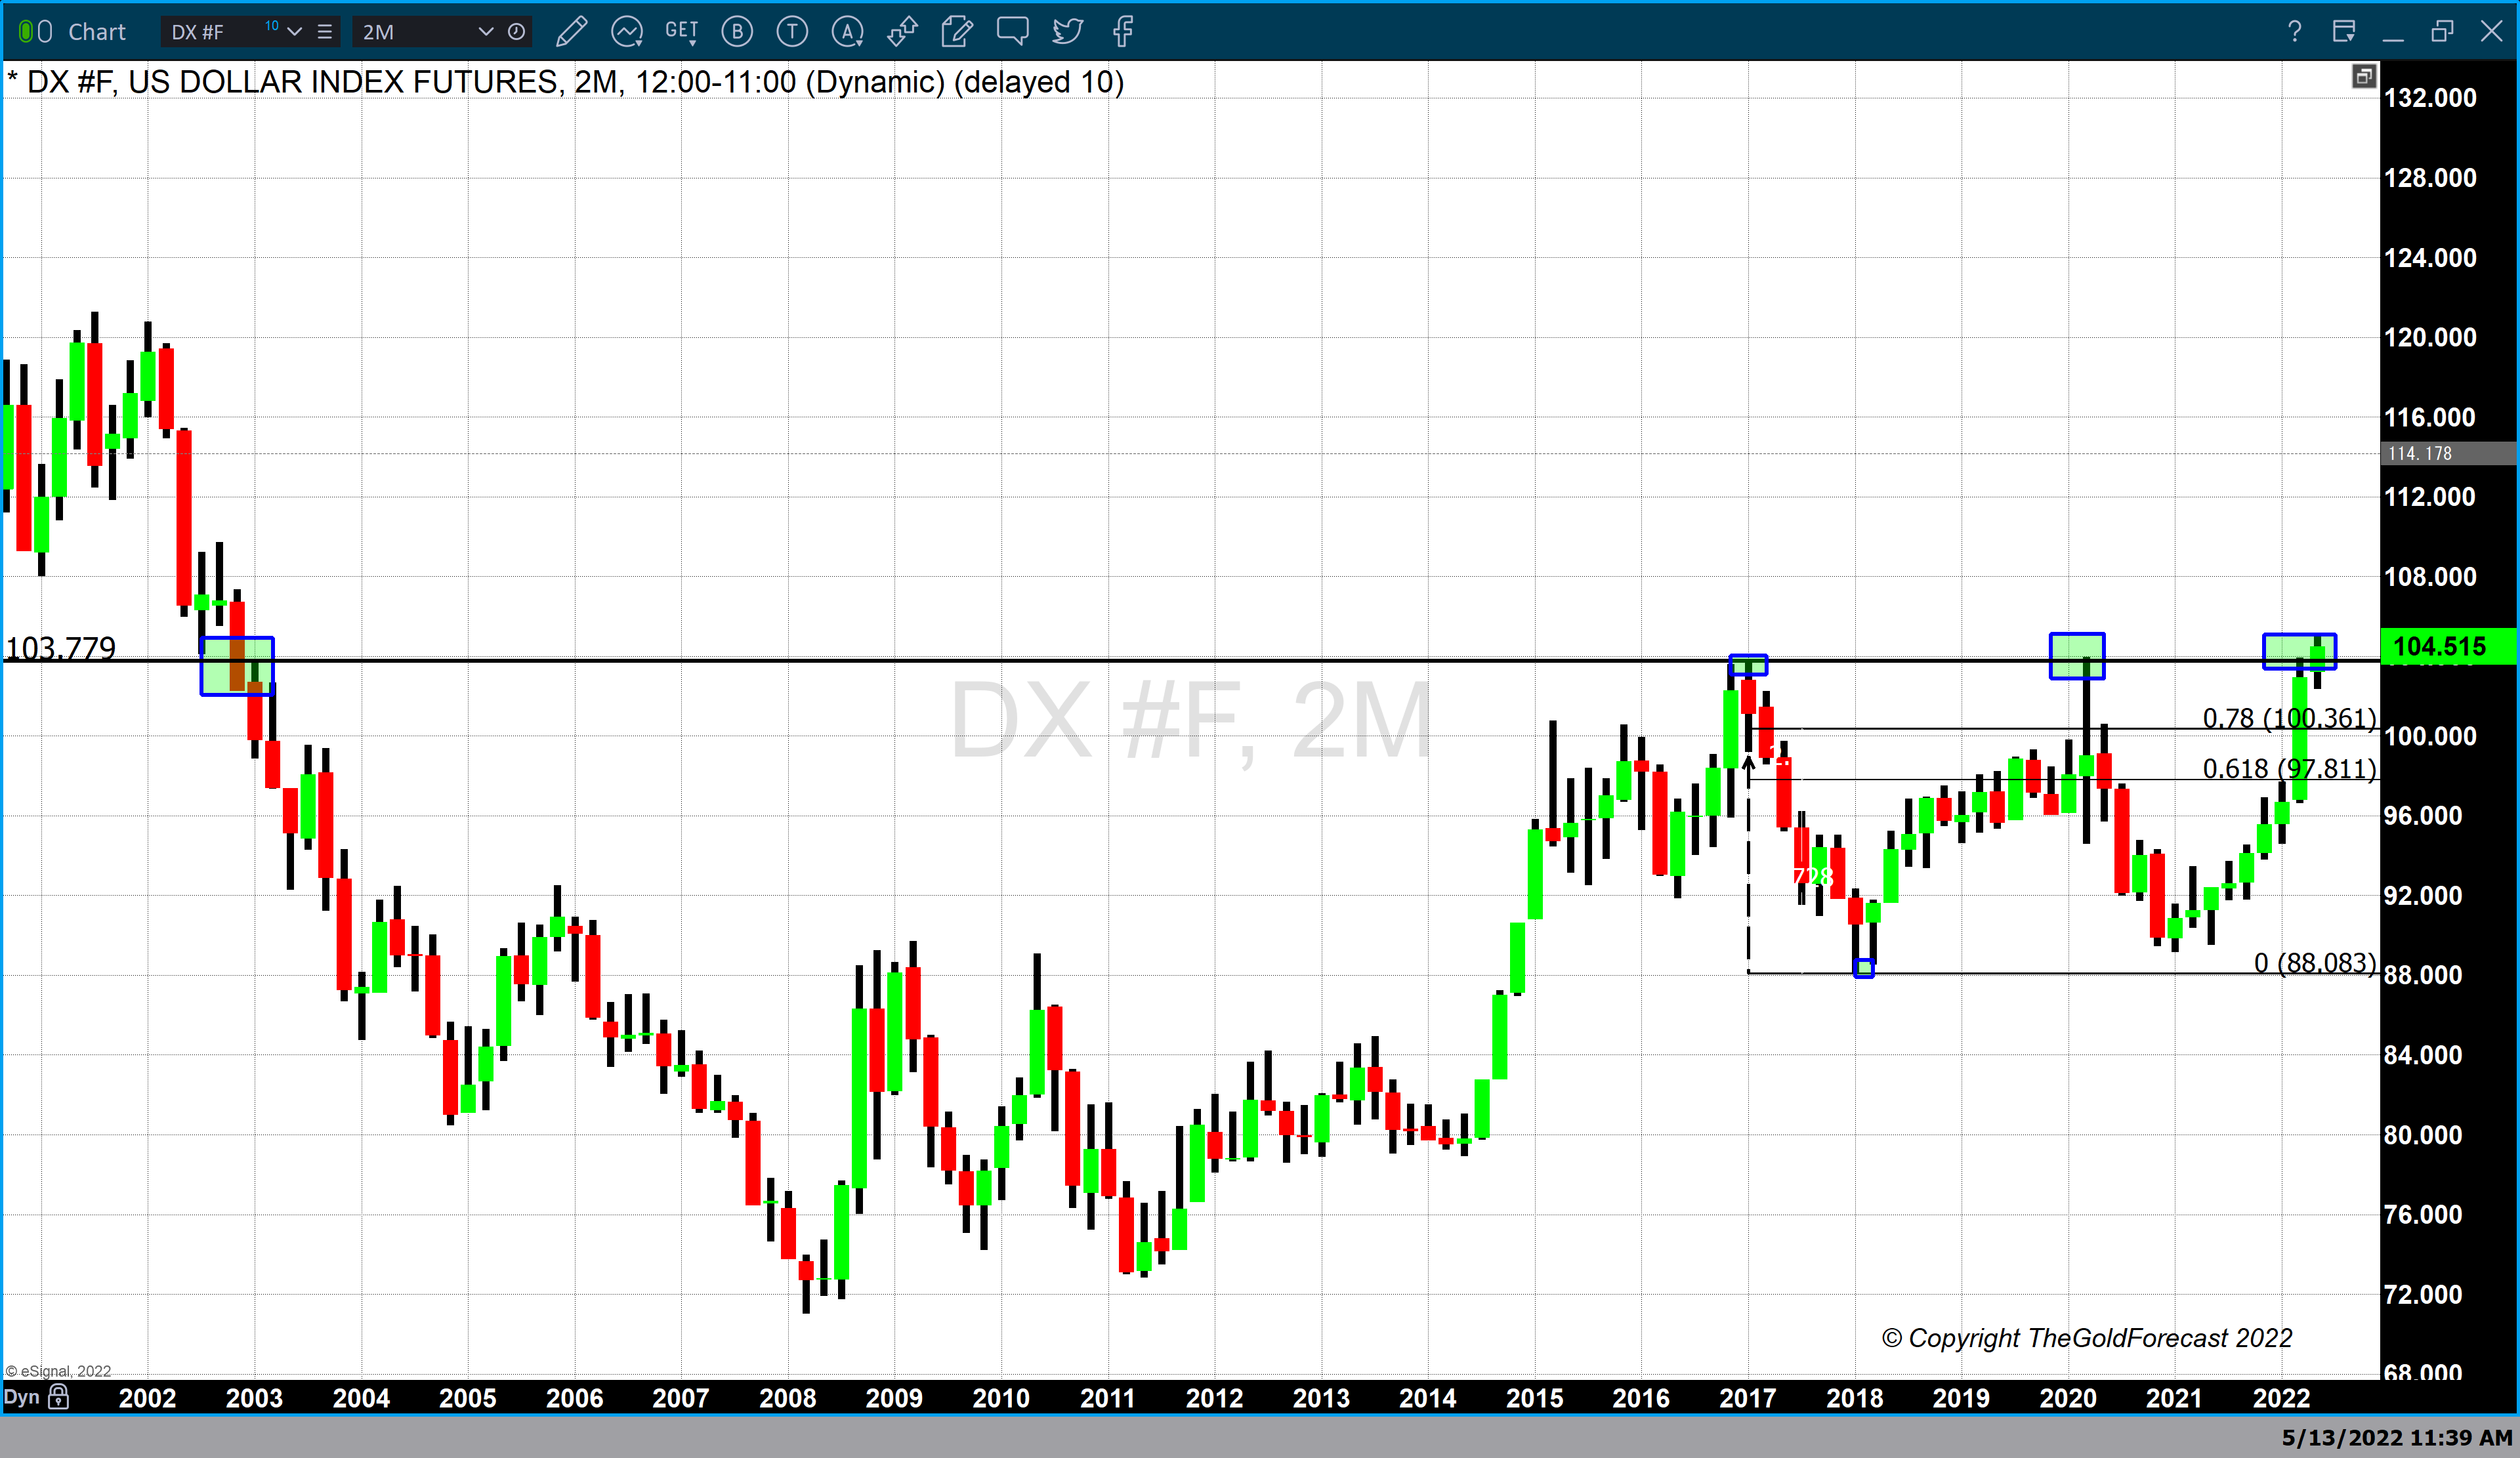
The dollar has been trading in a defined range since the beginning of 2017. In January 2017 the dollar index opened at 102.80 and traded to a high of 103. 78 becoming the first instance of dollar strength at this level since 2003. Since 2017 the dollar index has traded to this level on three occasions.
Both the 2017 top as well as the second instance which occurred in March 2020 created a double top. In both instances, dollar strength peaked at these levels resulting in a price correction that followed these tops. This month the dollar not only challenged the highs created during the double top but effectively closed above them on a daily, weekly, and monthly chart.
The dollar index declined today by - 0.36%. However, the dollar had a strong weekly gain. Currently, the dollar index is fixed at 104.515 and the last time the dollar was this strong was the fourth quarter of 2002.
Yesterday I addressed that recent price changes in the dollar and gold have been headlined driven based upon fundamental events. Because technical studies by nature are lagging indicators there is an inherent disconnect. I was blessed to be mentored by two great market technicians one being Larry Williams. He told me a story that illustrated the shortcoming of only using technical indicators.
To paraphrase: A market technician is analogous to someone standing at the stern of a boat and using the wake from the propeller to indicate the direction the ship was headed. While it indicated where the boat had been, only the captain knows when he will turn the wheel.
In this instance, the Federal Reserve is at the helm attempting to steer the ship through a storm brought on by rampant inflation
For those who would like more information simply use this link.
Wishing you, as always good trading,
Gary S. Wagner
The Gold Forecast


