Is The Dollar Headed Into The Abyss?

Back in January, I attempted to answer the question “Is Dollar's Dominance Over?”, as the dollar index (DX) had experienced significant losses.

However, we received two conflicting signals from the technical chart, which provided a bearish alert, and the interest rate differentials chart, which indicated support for the dollar.

In both polls, the majority of readers voted that the dollar's dominance was over and that it had already peaked for the dollar index.

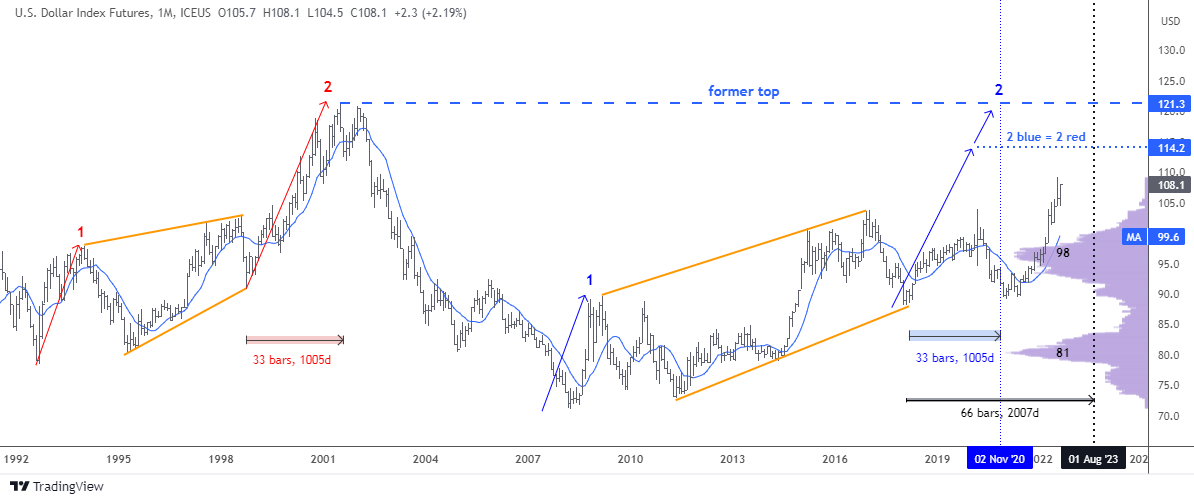
Since then, the DX has made a bounce close to $106 with the support of a hawkish Fed, however these gains proved to be unsustainable, and the price dropped back down to hit the valley established in January, reaching a new low of $100.

Is the dollar headed right into the abyss?

Let's take a look at some updated charts, starting with the interest rate differentials.

DX vs Real Interest Rates

Source: TradingView

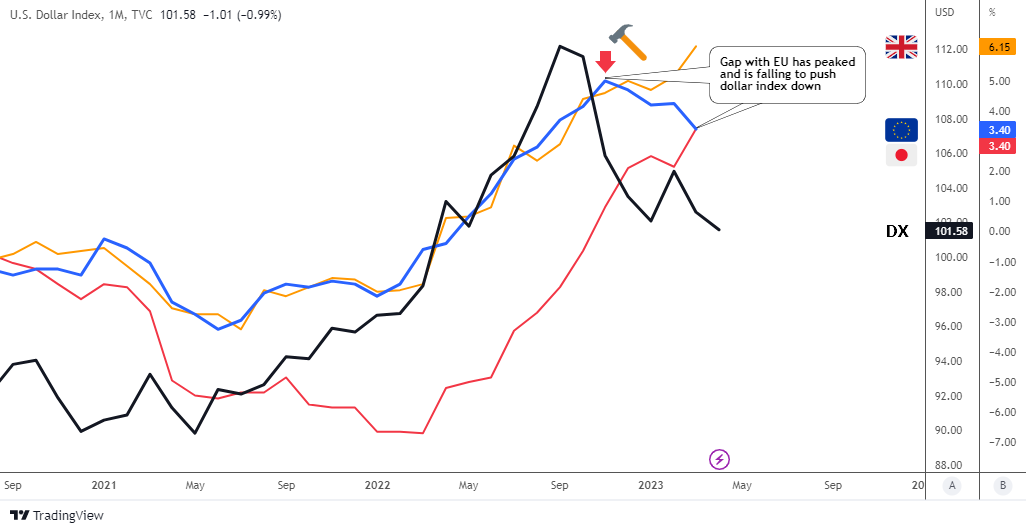
This time, I will be using a monthly time frame to provide a closer look at what could potentially cause the dollar to decline. Continue reading "Is The Dollar Headed Into The Abyss?"

Jobs Report Dropped A Bombshell On The Markets

The non-farm payrolls report released last Friday dropped a bombshell on the market, revealing the US economy added 517K jobs in January 2023, surpassing expectations of 185K and the highest since July 2022.

Growth was seen in leisure and hospitality, professional and business services, health care, government, retail trade, construction, transportation and warehousing, and manufacturing. Despite tech layoffs and potential economic slowdown, the labor market remains tight, with November and December job numbers revised higher.

This was a real shocker that caused huge, unexpected waves of volatility in the markets. Let’s have a look at 1-day futures performance last Friday in the diagram below. It looks like a red sea with a small island covered in green grass.

1 Day Futures Performance

Chart courtesy: finviz.com

Gasoline, silver and platinum were the ultimate losers that day with massive losses of -5.3%, -5.2% and -5.1% respectively. Gold futures lost huge -2.8% as well. Palladium futures price plummeted -1.8%. Among metals, Copper futures were the most resilient at -1.5%. Continue reading "Jobs Report Dropped A Bombshell On The Markets"

Dollar Ran Out of Time, Not Ammo

More than three years ago in my post titled, “Don't Get Trapped By Recent Dollar Weakness”, I shared with you a monthly chart of the dollar index (DX) futures with a map of large two-leg complex sideways consolidation. It was an experiment to try guessing the time target for the second blue leg to the upside based on the time it took second red leg to emerge.

Below is the updated chart with the same drawings enriched with the new highlights.

DX Futures Monthly

Source: TradingView

The time target was set on November 2020 when 33 bars in the second blue leg up emerge. The price had established the new top of $104 in March 2020 within those 33 bars. However, the minimum target of $114.2 on the price scale had not been reached and now 54 monthly bars appear on the chart.

If we divide 54 by 33 we will have the ratio of 1.64, which means the time period extended over the 1.618 Fibonacci ratio. This is a crucial time mark and last month the dollar index futures were really close to hitting the price target as it topped $109.1.

The next extension of doubling the time period with 66 bars to emerge falls on August 2023. It is enough time space for reaching both preset targets of $114.2 and $121.3.

I added two indicators on this updated chart. The purple one is the Volume Profile. It clearly has shown the strong barrier at the $98 level with the large volume traded there. When the price broke above that resistance, the speed of growth accelerated. It is the resistance being the strong support now. We should watch it closely in case the price drops there during correction.

The Simple Moving Average for the past year period is the blue line on the chart. It had accurately shown the reversal to the upside last year. The moving average confirms the support area of the Volume Profile indicator around $99.6 making it a double barrier for bears.

Three years ago the majority of readers misread the direction of the price as they bet on the drop of the dollar. Continue reading "Dollar Ran Out of Time, Not Ammo"

Dollar Index: The Last Shall Be First

Since my last update, the dollar advanced further to the upside establishing the new multi-year top of $105 in the middle of May. Later, the market started the correction as the dollar index (DX) drifted into the area of $101.

Last time, you bet the most on the further rise of the dollar to $121 (Neckline of Giant Double Bottom pattern). The second choice was the Bearish scenario for the main currency. It is early to judge the results as the price dynamics are somewhat mixed.

Let me show you one comparison graph that shows the underlying fundamentals of the dollar index. But, before that, to refresh the memory, firstly, I put below the chart showing the composition of the dollar index.

Dollar

The euro takes the largest piece of cake with 57.6%; the Japanese yen with 13.6% is the second largest component, although the gap with the euro is huge. The third is the British pound, as its part weighs 11.9%. Continue reading "Dollar Index: The Last Shall Be First"

Gold Suffers Its Fourth Straight Week Of Declines

Editor’s Note: I will be speaking at an upcoming conference The Vancouver Resource Investment Conference in British Columbia on May 17 and 18. For more information please click the link above.

Gold opened at $1977 on Monday, April 18, and this would mark the beginning of four consecutive weekly declines. As of 5:10 PM EDT gold futures basis, the most active June 2022 Comex contract is fixed at $1810.30 after factoring in today’s decline of $14.30 or 0.78%. Today’s decline in gold occurred without the benefit of dollar strength. The dollar index declined by 0.36% and is currently fixed at 104.515

Kitco Gold Index (KGX)

The image above is a screen-print of the KGX (Kitco Gold Index) which was taken at 4:37 PM EDT. At that time spot gold was fixed at $1810.80 after factoring in a decline of $10.70. Market participants were active sellers resulting in a $14.30 price decline. Dollar weakness provided mild tailwinds adding $3.60 (+0.20%) in value. Continue reading "Gold Suffers Its Fourth Straight Week Of Declines"