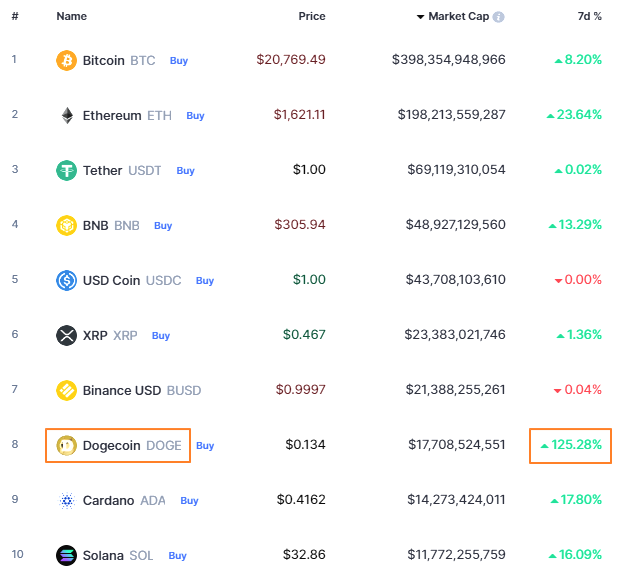
Last week the top ten cryptocurrencies ranking was reshuffled as Dogecoin (DOGE) shot straight to the eighth place with a market cap just under $18 billion. If we skip stable coins and exchange related coin BNB then this meme coin seized the #4 spot right below the Ripple (XRP).
If we look at the seven-day performance of top ten cryptos in the table below – none of them could boast the triple digit gain that we see in Dogecoin with +125% growth.
If this rally stays intact, the Ripple could lose its #3 spot soon. The price of the DOGE should add another 1/3 to 18 cents for this to happen.
What has fueled such a strong rally of this coin? The main reason is the hope that comes with the final takeover of Twitter by Elon Musk, who is a big fan of the DOGE and he pledged to support this meme coin.
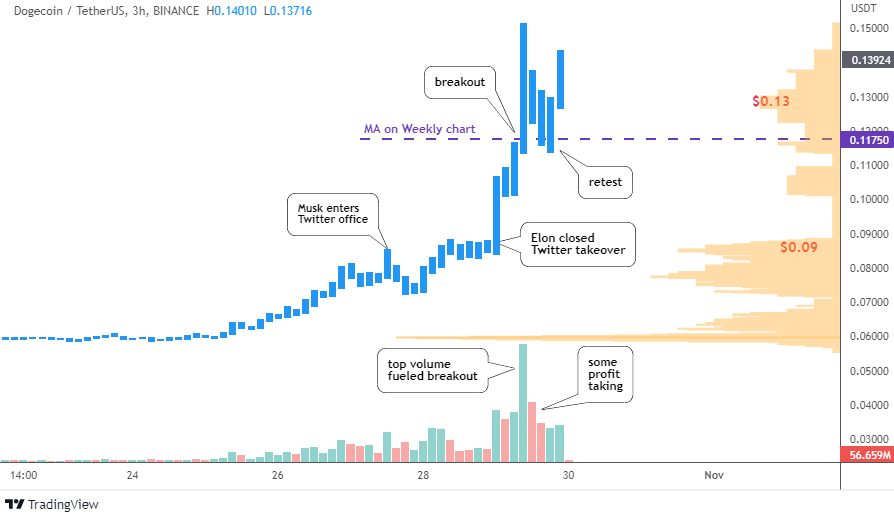
Let me show you the anatomy of the rally in the 3-hour chart below.
The 5-6 cents level was the base for the coin’s rally as we can see the largest volume profile zone (orange) there and tiny bars of low activity on the volume graph (red/green vertical bars).
The volume bars started to grow from the last Tuesday to become visible on the chart. It was mostly green as the price crossed the 8 cents handle when the video with Mr. Musk visiting the Twitter office has flown around the world.
The real rally started after Elon closed the deal on Twitter last Friday at the end of the day. The largest green volume bar pushed the price beyond 15 cents on Saturday. The price has crossed over the moving average (purple, seen on the weekly chart below) above $0.1175. The same day we can see some profit taking as volume bars turned red when the price dipped to retest the moving average. After that, the DOGE resumed higher.
The 13 cents level is a large volume profile area above the moving average. The next support is the 8-9 cents level where buyers accumulated a decent volume ahead of the rally.
Let us move on to the big map to see what’s beyond the short-term horizon.
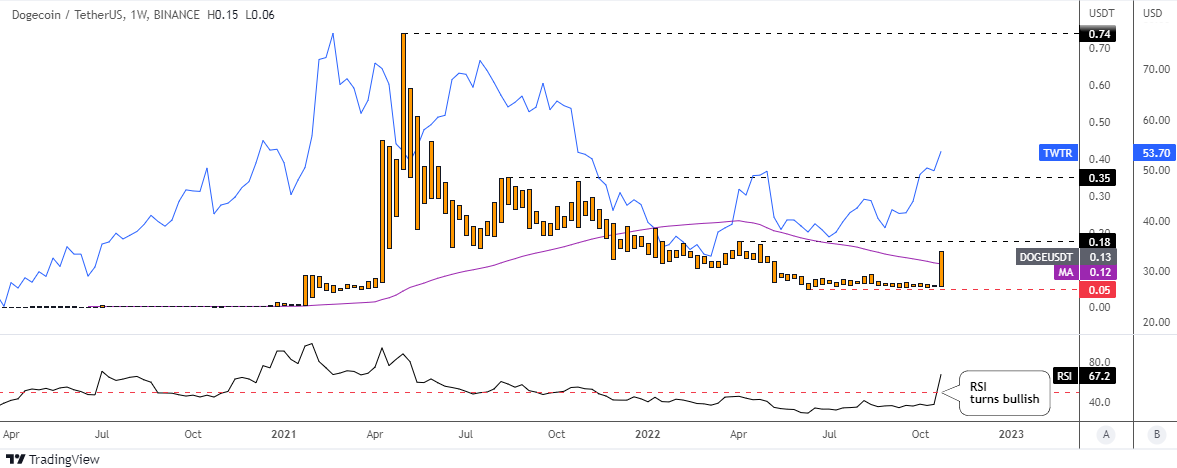
Last week’s bar alone has reversed back almost all losses of the coin from this May as the price eyes the next resistance at 18 cents. The purple one-year moving average I was talking above has been shown in this weekly chart. The price has surpassed it to jump into a bullish mode.
The RSI has crossed over the crucial 50 level like a knife through butter.
I added Twitter stock price (TWTR, blue line, scale B) to the chart as I noted a strong correlation between these two instruments. We could call it Elon’s toys chart. The TWTR is a leader as it moves ahead of the coin. The DOGE followed both the previous rally of the Twitter stock and the following collapse of it.
This time the stock price has turned higher much earlier than the coin as the takeover news spurred a strong demand for the media stock. If history may repeat itself, the meme coin could try to catch up with the Twitter’s rally to fly to 40 cent area. It is just slightly above the next resistance of 35 cents based on the top of August 2021.
I guess many fans of the coin are waiting for the price to revisit the all-time high of 74 cents sooner or later.
The bearish scenario will be triggered if the RSI sinks below 50 and the price falls under the hype area of 8-9 cents.
Intelligent trades!
Aibek Burabayev
INO.com Contributor
Disclosure: This contributor has no positions in any stocks mentioned in this article. This article is the opinion of the contributor themselves. The above is a matter of opinion provided for general information purposes only and is not intended as investment advice. This contributor is not receiving compensation (other than from INO.com) for their opinion.


Since Elon is involved I feel success is coming