Gold And The Era Of Rising Interest Rates

Aibek Burabayev - INO.com Contributor - Metals


The U.S. dollar is the primary benchmark for the expense of the time value of the money around the world. It affects all asset classes, and I want to analyze it to see if the speculation about the coming cycle of the rise in interest rates is valid or not.

The wise trader once said; “if you want to know the market trend just squeeze the chart to see the perspective.” I used that advice to focus on the long-term perspective, and in this post, I would like to share the result of my research in the three graphs below.

Chart 1. The Yield Of 10-Year U.S. Treasury Notes Quarterly: Downtrend Could Be Over Soon

Quarterly Chart of 10 Year U.S. Treasury Notes
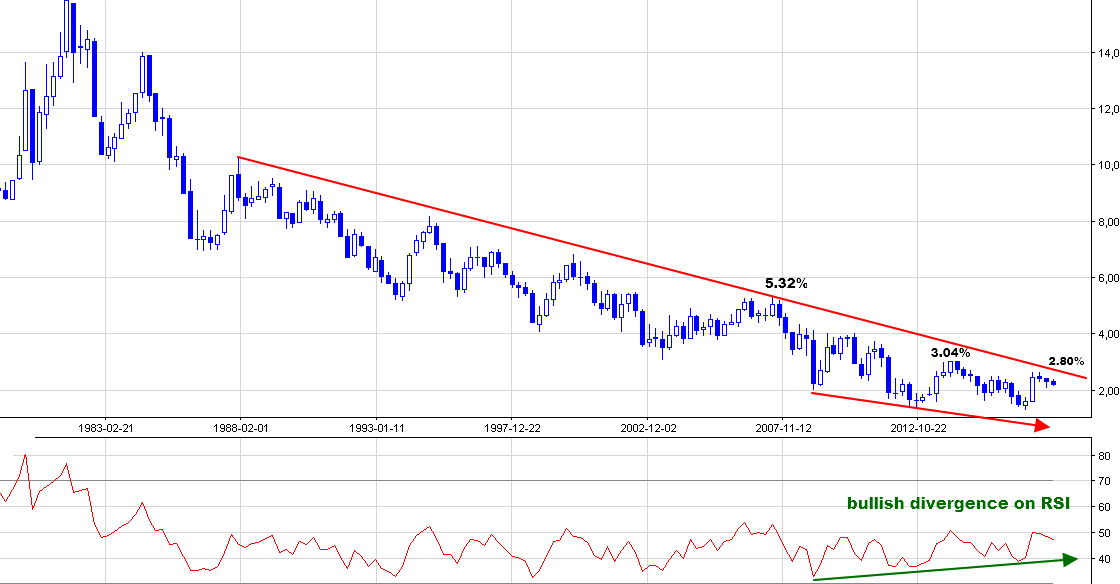
Chart courtesy of stooq.com

The chart above shows the history of the yield on the 10-Year U.S. Treasury notes (UST) from 1980 to present day. I chose that period to highlight the whole move down of the yield from the top in 1981 at the 15.84%. I chose this instrument as it is a benchmark showing investors’ sentiment about the future interest rates for the U.S. dollar. Continue reading "Gold And The Era Of Rising Interest Rates"

Stock Analysis From A To Z: Letter "C"

Aibek Burabayev - INO.com Contributor - Metals


There is not much change in the precious metals charts, and that gave me a chance to find some trading setups for stocks. In this post, I would like to share my analysis of the stocks starting with the letter “C.”

Table 1. Filtered Stocks For Letter “C”

Letter C stocks
Chart courtesy of finviz.com

Out of the 19 screened stocks I’ve selected three to analyze as they have clearer chart structure: CAVM, CNK, and CPE. All of them have potentially good short setups. It looks like not all companies could keep the pace with the rising S&P 500 index which continues to make record highs one after the other. Continue reading "Stock Analysis From A To Z: Letter "C""

Copper Eyes $3 Amid Upbeat Chinese Data

Aibek Burabayev - INO.com Contributor - Metals


Back in May, I posted an update for copper where I shared my concerns about the possible negative impacts of the cooling Chinese economy. At the same time the technical chart didn’t confirm those concerns and on the contrary, showed a possible upside move for the metal.

In this post, I would like to share some macro economic charts and an update of the technical chart.

Chart 1. Copper Vs China Industrial Production (Monthly)

China Industrial Production vs. Copper
Chart courtesy of tradingeconomics.com

I chose the period of the chart above from the start of 2016 intentionally to highlight the time when the metal began to consolidate after a huge drop down. Continue reading "Copper Eyes $3 Amid Upbeat Chinese Data"

Gold & Silver: Gold Breaks Up As Silver Licks Wounds

Aibek Burabayev - INO.com Contributor - Metals


The broad weakness of the U.S. dollar supported precious metals and currencies. Gold has been saved from silver's Flash Crash destiny so far. Below are the updated charts for gold and silver.

Chart 1. Gold Daily: Breaking Upside

Daily Gold Chart
Chart courtesy of tradingview.com

The experimental clone chart for gold that I posted in April amazingly finished its move down as planned although later than expected. The anticipated reverse to the upside followed the end of the consolidation highlighted with the gray rectangle. Continue reading "Gold & Silver: Gold Breaks Up As Silver Licks Wounds"

Silver Stocks: This Penny Stock Became A Superstar

Aibek Burabayev - INO.com Contributor - Metals


The continued weakness in the silver price offers opportunities to buy silver stocks, which have followed the metal to the downside. This time I selected three of the top silver stocks by their P/E ratio for analysis.

Table 1. Top Silver Stocks By P/E


Image courtesy of finviz.com

Top three companies are:

1. Silvercorp Metals Inc. (NYSE:SVM)
2. Coeur Mining Inc. (NYSE:CDE)
3. Silver Standard Resources Inc. (NASDAQ:SSRI)

Silver started to drop into a long lasting correction a year ago on the 4th of July, 2016. Below is a comparison chart of three stocks and silver itself to show you how they performed relative to each other. Continue reading "Silver Stocks: This Penny Stock Became A Superstar"