GLD vs. SLV: Investors Favor Less Successful Gold

Aibek Burabayev - INO.com Contributor - Metals


Today I would like to share with you an analysis of precious metals ETFs. The goal of the study is to identify the correlation of price moves in both gold and silver with the demand for their ETF shares, represented by an appropriate precious metals holdings change. Below the chart you will read some interesting findings.

Chart 1. Gold, Silver and ETFs (Q/Q percent change): Silver Rises Without ETF Support

Gold, Silver and ETFs (Q/Q percent change): Silver Rises Without ETF Support
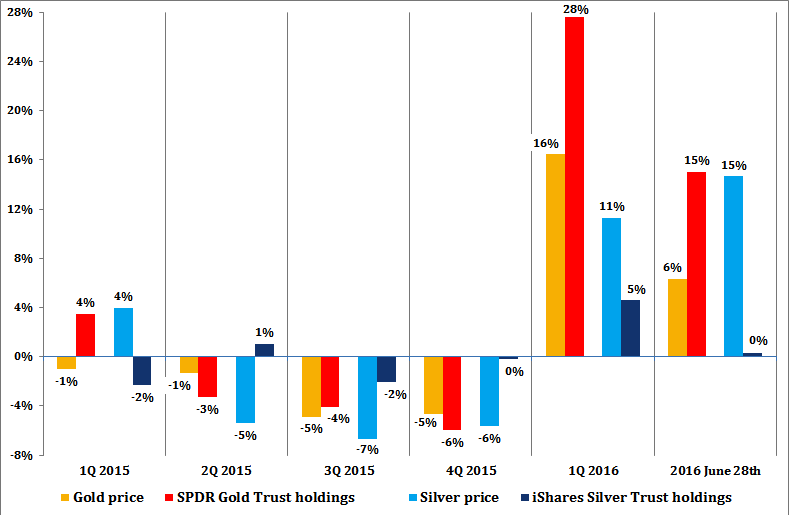
Chart by Aibek Burabayev, data source: spdrgoldshares.com; ishares.com

In the first quarter of the last year, we can see that investors were betting on a bottoming gold price with a 4% rise in SPDR Gold Trust (PACF:GLD) holdings despite the 1% fall in price. It’s interesting that at the same period, investors, on the contrary, cut their silver ETF holdings despite the rising silver price; it looks like they used the ‘sell silver on spike’ approach to gain on metals correlation. It’s amazing! But they were right shorting silver as it fell in three consecutive periods exceeding gold’s losing streak. Continue reading "GLD vs. SLV: Investors Favor Less Successful Gold"

It's Official, They Exit! Risk Aversion Chronicles: Gold Leads The Safety Demand!

Aibek Burabayev - INO.com Contributor - Metals


Today is a historic day in World financial history, which will be recorded in our memory forever! And it was a long and sleepless night all over the world as financial markets were frozen in agonizing suspense.

We should admit that Britons are firm and consecutive in pursuing their goal of independence. Almost a quarter century ago, they decided to withdraw their currency from the European Exchange Rate Mechanism (ERM) and they didn’t turn off their road yesterday on the final referendum.

Bookies and analysts got it all wrong as they forecasted the win of the "STAY” option, but more and more we have witnessed that all efforts to calculate human emotions and perceptions fail. The economic consequences for Brexit are harmful to the UK in a short term, but they still voted to leave. People are irrational in their behavior and the realization of this fact would bring the dramatic changes in the economic science in the future. Continue reading "It's Official, They Exit! Risk Aversion Chronicles: Gold Leads The Safety Demand!"

Gold Vs. S&P 500: Fly To Safety?

Aibek Burabayev - INO.com Contributor - Metals


Chart 1. Gold Vs. S&P 500: Saucer Reversal Pattern

Gold Vs. S&P 500: Saucer Reversal Pattern
Chart courtesy of tradingview.com

The Gold/S&P 500 ratio made a new high this past February breaking above both the August 2015 and October 2014 maximums. It has finally managed to surpass the depressing red resistance. The break was strong and violent pushing the ratio from 0.51 low to 0.68 high. After it runs out of steam we always witness a pullback ( the market digests the price action), the ratio returned to the point of the break at the end of May and now is starting the next round up.

This is a very healthy market move as the price pulled back, but hasn’t broken below the starting point. The first higher high and higher lower are in place now. Once we get a new higher high, we can draw an uptrend with confirmed touch points. Continue reading "Gold Vs. S&P 500: Fly To Safety?"

Gold & Silver: First Pullback

Aibek Burabayev - INO.com Contributor - Metals


Chart 1. Gold Daily: Second to Win but First to Hold

Gold: Daily Chart
Chart courtesy of tradingview.com

The top metal has was just $4 from reaching the target of $1307 which was set in my March post. It had reached a high of $1303 on May 2nd before it started a one-month long correction anticipated in the same post. The depth of the correction is minimal at 38.2% and is well above the normal retracement area within the 50-78.6% range ($1176-$1101) highlighted in the March post. Continue reading "Gold & Silver: First Pullback"

The Dollar Takes 'EM Down

Aibek Burabayev - INO.com Contributor - Metals


Dear readers, I am very grateful to get all your feedback and suggestions that you kindly share with me all the time! Rasesh Shukla, one of our regular readers asked about the Emerging market currencies and particularly about Indian rupee in a comment this month. And I am pleased to share my thoughts with all of you in this post.

Chart 1. 5-Year Dynamics of Top FX vs. EM FX

5-Year Dynamics of Top FX vs. EM FX
Chart courtesy of tradingview.com

I want to start with the comparison chart of the top currencies presented by inverse dollar index, consisting of 6 currencies: Euro, Japanese Yen, British Pound, Canadian Dollar, Swedish Krona and Swiss Franc (orange line) versus the emerging market currencies presented by WisdomTree Emerging Currency Strategy Fund (CEW, green line). The former is quite representative, it tracks the value of the following 15 currencies: Mexican Peso, Brazilian Real, Chilean Peso, Colombian Peso, South African Rand, Polish Zloty, Russian Ruble, Turkish New Lira, Chinese Yuan, South Korean Won, Indonesian Rupiah, Indian Rupee, Malaysian Ringgit, Philippine Peso and Thai Baht. Continue reading "The Dollar Takes 'EM Down"