Now is the Time to Hedge Your Portfolio

A few weeks ago, I asked if you believed the current rally was here to stay. At that time, the market had been rallying since the middle of June. Some market participants were calling the June low 'the bottom.'

Time will tell if June was the bottom, but based on what has happened over the last two weeks of August, I am betting that we have not yet seen the bottom.

Let's review quickly what just occurred. The Federal Reserve's President, Jerome Powell, told the country that there would be "some pain" in the coming months. Powell also said that the Fed would "keep at it until the job is done," referring to getting inflation under control.

Powell didn't detail how severe the pain would be or how businesses and households would feel it. Still, I think it is safe to say that Powell acknowledges we are likely heading towards a recession.

The market's reaction to Powell's comments sent the S&P 500 down 9.2% since the August 16 high of 4,327. The NASDAQ is down 11%, while the Dow Jones Industrial Average is off by 8.2% since August 16.

Not only is the NASDAQ down double digits, but the exchange-traded funds that track the major indexes, The SPDR S&P 500 ETF (SPY) and the Invesco NASDAQ QQQ ETF (QQQ), are both now trading below their 50-day averages. That is in addition to them already having given up their 200-day, 100-day, and 20-day moving averages.

Furthermore, economist after economists, jumped on the 'recession is imminent', bandwagon this past week. Most of these economists have even pointed out that the Federal Reserve has miscalculated the intense inflation we are experiencing.

They were referring to when the Fed told us back in the spring that the inflation we were experiencing at that time was "transitory." The Fed was wrong about that, and it is unlikely that the Fed members want to be wrong again by underestimating the persistence of current inflationary causes.

Due to their previous missteps, many believe the Fed will not take its foot off the gas quickly enough. This makes it unlikely the economy will experience a soft landing which we have been hearing about over the past few months.

And if you don't know the opposite of a 'soft landing' in economics, it's a recession. Continue reading "Now is the Time to Hedge Your Portfolio"

Two Growth Stocks With Relative Strength

It’s been a volatile month thus far for the S&P-500 (SPY), with the index starting the month up nearly 5% before giving back all of its month-to-date gains.

This sharp reversal should not be surprising, given that the 200-day moving average is often a strong area of resistance for the general market when it’s in an intermediate downtrend.

From a fundamental standpoint, the give-back also makes sense, given that little has fundamentally changed with the Federal Reserve still laser-focused on stamping out inflation, regardless of the collateral damage caused by its hawkish stance.

SPX August

(Source: Twitter, ND Wealth Management, Steve Deppe)

Given the weak performance, the market is now on track to close August down more than 10% year-to-date, which has historically led to further drawdowns in all cases. In fact, the median forward draw-down over the following twelve months was 15.5%, and even using the best four case drawdowns, the average twelve-month forward draw-down was 5.5%.

History doesn’t repeat itself, but it often rhymes, and assuming the S&P-500 closed at 4000 for August, this would point to a drawdown to 3380 between now and summer 2023, or a best case drawdown (average of four smallest draw-downs) to 3780. With even the best-case scenario points to a meaningful downside, caution remains warranted.

The good news is that it’s a market of stocks, not a stock market. Even in intermediate bear markets, investors can enjoy alpha by hunting down the best growth names that exhibit unique relative strength characteristics.

With many FAANG names down over 50%, finding stocks in intermediate uptrends is challenging, but there are a few stand-out names that also have impressive growth metrics. This combination is a recipe for success in all markets, and in this update, we’ll look at two names that fit this bill: Continue reading "Two Growth Stocks With Relative Strength"

Chart Spotlight: ChargePoint Holdings Inc. (CHPT)

With demand for electric vehicles on the run, investors may want to keep an eye on charging stocks, like ChargePoint Holdings (CHPT).

Remember, not only do global leaders want millions of EVs on the road, California is about to prohibit the sale of gas-powered cars.

“The rule, issued by the California Air Resources Board, will require that 100 percent of all new cars sold in the state by 2035 be free of the fossil fuel emissions chiefly responsible for warming the planet, up from 12 percent today. It sets interim targets requiring that 35 percent of new passenger vehicles sold in the state by 2026 produce zero emissions. That would climb to 68 percent by 2030,” according to The New York Times.

For that to become a reality, we need EV charging stations – lots of them.

In fact, the Biden Administration already announced that all 50 U.S. states, Washington, D.C., and Puerto Rico have all submitted plans for a national EV charging network.

“These plans are required to unlock the first round of the $5 billion of Bipartisan Infrastructure Law formula funding available over 5 years to help states accelerate the important work of building out the national EV charging network and making electric vehicle charging accessible to all Americans,” according to the U.S. Department of Transportation.

ChargePoint Holdings Stock Technically Oversold

It's all part of the reason why oversold shares of CHPT are starting to pivot higher. All after pulling back from about $19 to $14 thanks to a broad market pullback. Even better, the stock is oversold on Williams’ %R, Fast Stochastics, and RSI.

CHPT Chart With Trade Triangles

Source: MarketClub

Continue reading "Chart Spotlight: ChargePoint Holdings Inc. (CHPT)"

Bitcoin and Ethereum: No Safety Net

Earlier this month, I updated on the crypto market with a title, 'It Ain't Over Yet". I considered the recent strength in the main cryptocurrencies a "dead-cat bounce" within a classic sideways consolidation with a high probability of resuming collapse.

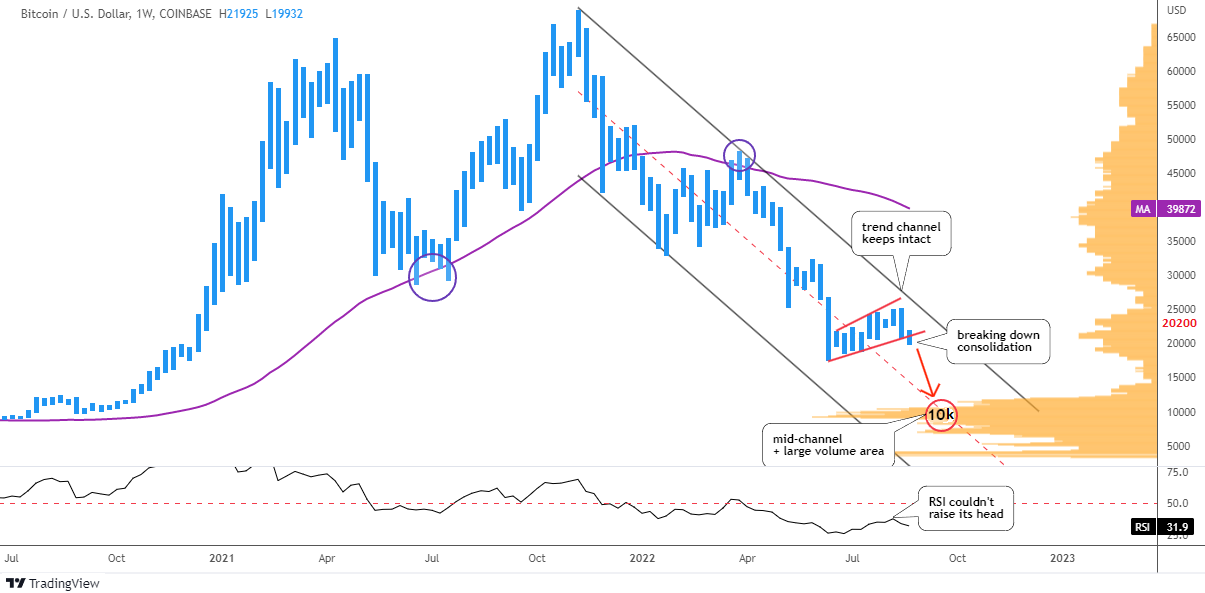
This time, I spotted new signals as the chart moves to the right building new bars over time. Let us start with the main coin in the weekly chart below.

Bitcoin Weekly Chart

Source: TradingView

The price of Bitcoin moves within large bearish trend channel (black). The top of above-mentioned sideways consolidation within red trendlines did not even approach the resistance, it stays intact.

The RSI indicator could not raise its head to test the “waterline” of 50 level. This means that the market has considered this short-term strength as a "dead-cat bounce" as well.

The chart bar of last week has punctured below the red support. This is a harbinger of another drop. The main coin indeed is looking into the abyss as the strong support appears only after the price halves down. The largest area of the Volume Profile histogram (orange) is located between $9k and $10k. The mid-channel (red dashed) fortifies that support with its intersection.

Your biggest bet last time was the drop of the Bitcoin down to $12.2k, where the second leg down is equal to the first one. It almost coincides with the above-mentioned double support.
The next volume area is located at the $4k level and this option was your least favorite.

This time I added the simple moving average (purple) covering the preceding 52 weeks (1 year). It has been offering a strong support to the price starting from 2020. This year it has flipped to become a strong resistance after the price has dropped below it. The $40k level is the barrier to break to confirm the new bullish cycle.

A rather interesting situation has developed for the main coin. The price should either half down to find support or it should double up from this level to crack the bearish cycle. Continue reading "Bitcoin and Ethereum: No Safety Net"

The Excess Phase Peak Pattern

The Excess Phase Peak pattern is a very common transitional phase for the markets where psychology and economic trends shift over time. Global markets typically require periods of pause, reversion, or a reset/revaluation event to wash away excesses.

We’ve seen these types of setups happen near the DOT COM and 2007-08 market peaks. What happens is traders are slow to catch onto the shifting phases of the Excess Phase Peak and sometimes get trapped thinking, “this is the bottom – time to buy.”

The reality is that as long as the individual phases of the Excess Phase Peak continue to validate (or confirm), then we should continue to expect the next phase to execute as well. In other words, unless the Excess Phase Peak pattern is invalidated somehow, it is very likely to continue to execute, resulting in an ultimate bottom in price many months from now.

The 5-Phases Of The Excess Phase Peak Pattern

The Excess Phase Peak Pattern starts off in a very strong rally phase. This rally phase normally lasts well over 12 to 24 months and is usually driven by an extreme speculative phase in the markets.

Once a price peak is reached and the markets roll downward by more than 7~10%, that’s when we should start to apply the five unique phases of the Excess Phase Peak Pattern. If each subsequent phase validates after the peak, then the Excess Phase Peak Pattern is continuing. If any phase is invalidated, then the pattern has likely ended.

For example, if we start by completing Phase #1 & #2, then the market rallies to a new all-time high – that would invalidate the Excess Phase Peak Pattern.

Here are the Phases of the Excess Phase Peak Pattern:

  1. The Excess Phase Rally Peak
  2. A breakdown from the Excess Phase Peak sets up a FLAG/Pennant recovery phase.
  3. Sets up the Intermediate support level – the last line of defense for price.
  4. Price retests #3 support & breaches the support level – starting a new downtrend.
  5. The final breakdown of the price is below the Phase 4 support level. This usually starts a broad market selling phase to an ultimate bottom.

Continue reading "The Excess Phase Peak Pattern"