New Leveraged Marijuana ETF

Managers of the largest marijuana-focused Exchange Traded Fund now offer a 2X leveraged marijuana fund. Investors must ask themselves, “will this 2X leveraged fund give their portfolio what it needs right now to get back on track in 2022?”

The AdvisorShares MSOS 2X Daily ETF (MSOX) will offer investors a way to gain 200% exposure to the basket of marijuana stocks that the AdvisorShares management team deems viable investments.

The same company manages MSOX as the AdvisorShares Pure U.S. Cannabis ETF (MSOS). MSOS is the largest marijuana-focused fund by market capitalization at $631 million.

MSOS has overtaken the previous ETF to hold that title, the ETFMG Alternative Harvest ETF (MJ), which now has assets under management of just under $400 thousand.

With MSOS being as popular as it is, it makes sense for AdvisorShares to offer a 2X leveraged product. Especially with several states of local governments planning on voting on the legalization and decriminalization of marijuana use. If a few more states start allowing the use of marijuana, we may see the next big rally in the space. This would put MSOS and, of course, MSOX in an excellent position to capitalize on the move higher.

But making a profitable investment usually isn’t always relatively that easy. The MSOX or 2X ETF also deals with contango. The fund tells investors that MSOX should only be used for daily exposure, not a long-term holding.

Plus, little things like when a fund like this debuts is important. For example, the ETFMG 2X Daily Alternative Harvest ETF (MJXL) is essentially the same ETF as the new MSOX. They both offer investors 2X leverage on the marijuana industry.

However, MJXL debuted in July of 2021, and if you have followed the marijuana industry, you will know that industry has been down since around February 2021. The falling underlying assets or company stock prices and the daily contango effect have left MJXL with minimal assets under management. Currently, MJXL has just over $563 thousand in assets.

ETFMG also has the 2X inverted marijuana ETF, the ETFMG 2X Daily Inverse Alternative Harvest ETF (MJIN). This ETF allows investors to short the marijuana industry and get 2X the short exposure. Like MJXL, MJIN doesn’t have a lot of assets under management at just $9.95 million, but it is ten times more than MJXL currently has under control. Continue reading "New Leveraged Marijuana ETF"

Chart Spotlight: Tesla (TSLA)

Shares of Tesla (TSLA) just split 3:1 and now trades around $300 a share.

From here, the EV stock could accelerate well above $900 again, near-term - all thanks to substantial catalysts.

According to MarketClub, the short- and intermediate-trends are positive. The RSI, Fast Stochastics, and Williams’ %R are all pivoting well off recent lows.

TSLA Chart With Trade Triangles

Source: MarketClub

Electric vehicle demand is only accelerating. Not only do global leaders want millions of EVs on the road, California is about to prohibit the sale of gas-powered cars.

In fact, “The rule, issued by the California Air Resources Board, will require that 100 percent of all new cars sold in the state by 2035 be free of the fossil fuel emissions chiefly responsible for warming the planet, up from 12 percent today. It sets interim targets requiring that 35 percent of new passenger vehicles sold in the state by 2026 produce zero emissions. That would climb to 68 percent by 2030,” according to The New York Times.

Historically, investors love TSLA stock splits. The last time TSLA split – in August 2020 – the stock price surged 60% from the day of the announcement until its execution. Continue reading "Chart Spotlight: Tesla (TSLA)"

Dollar Strength VS Gold Weakness

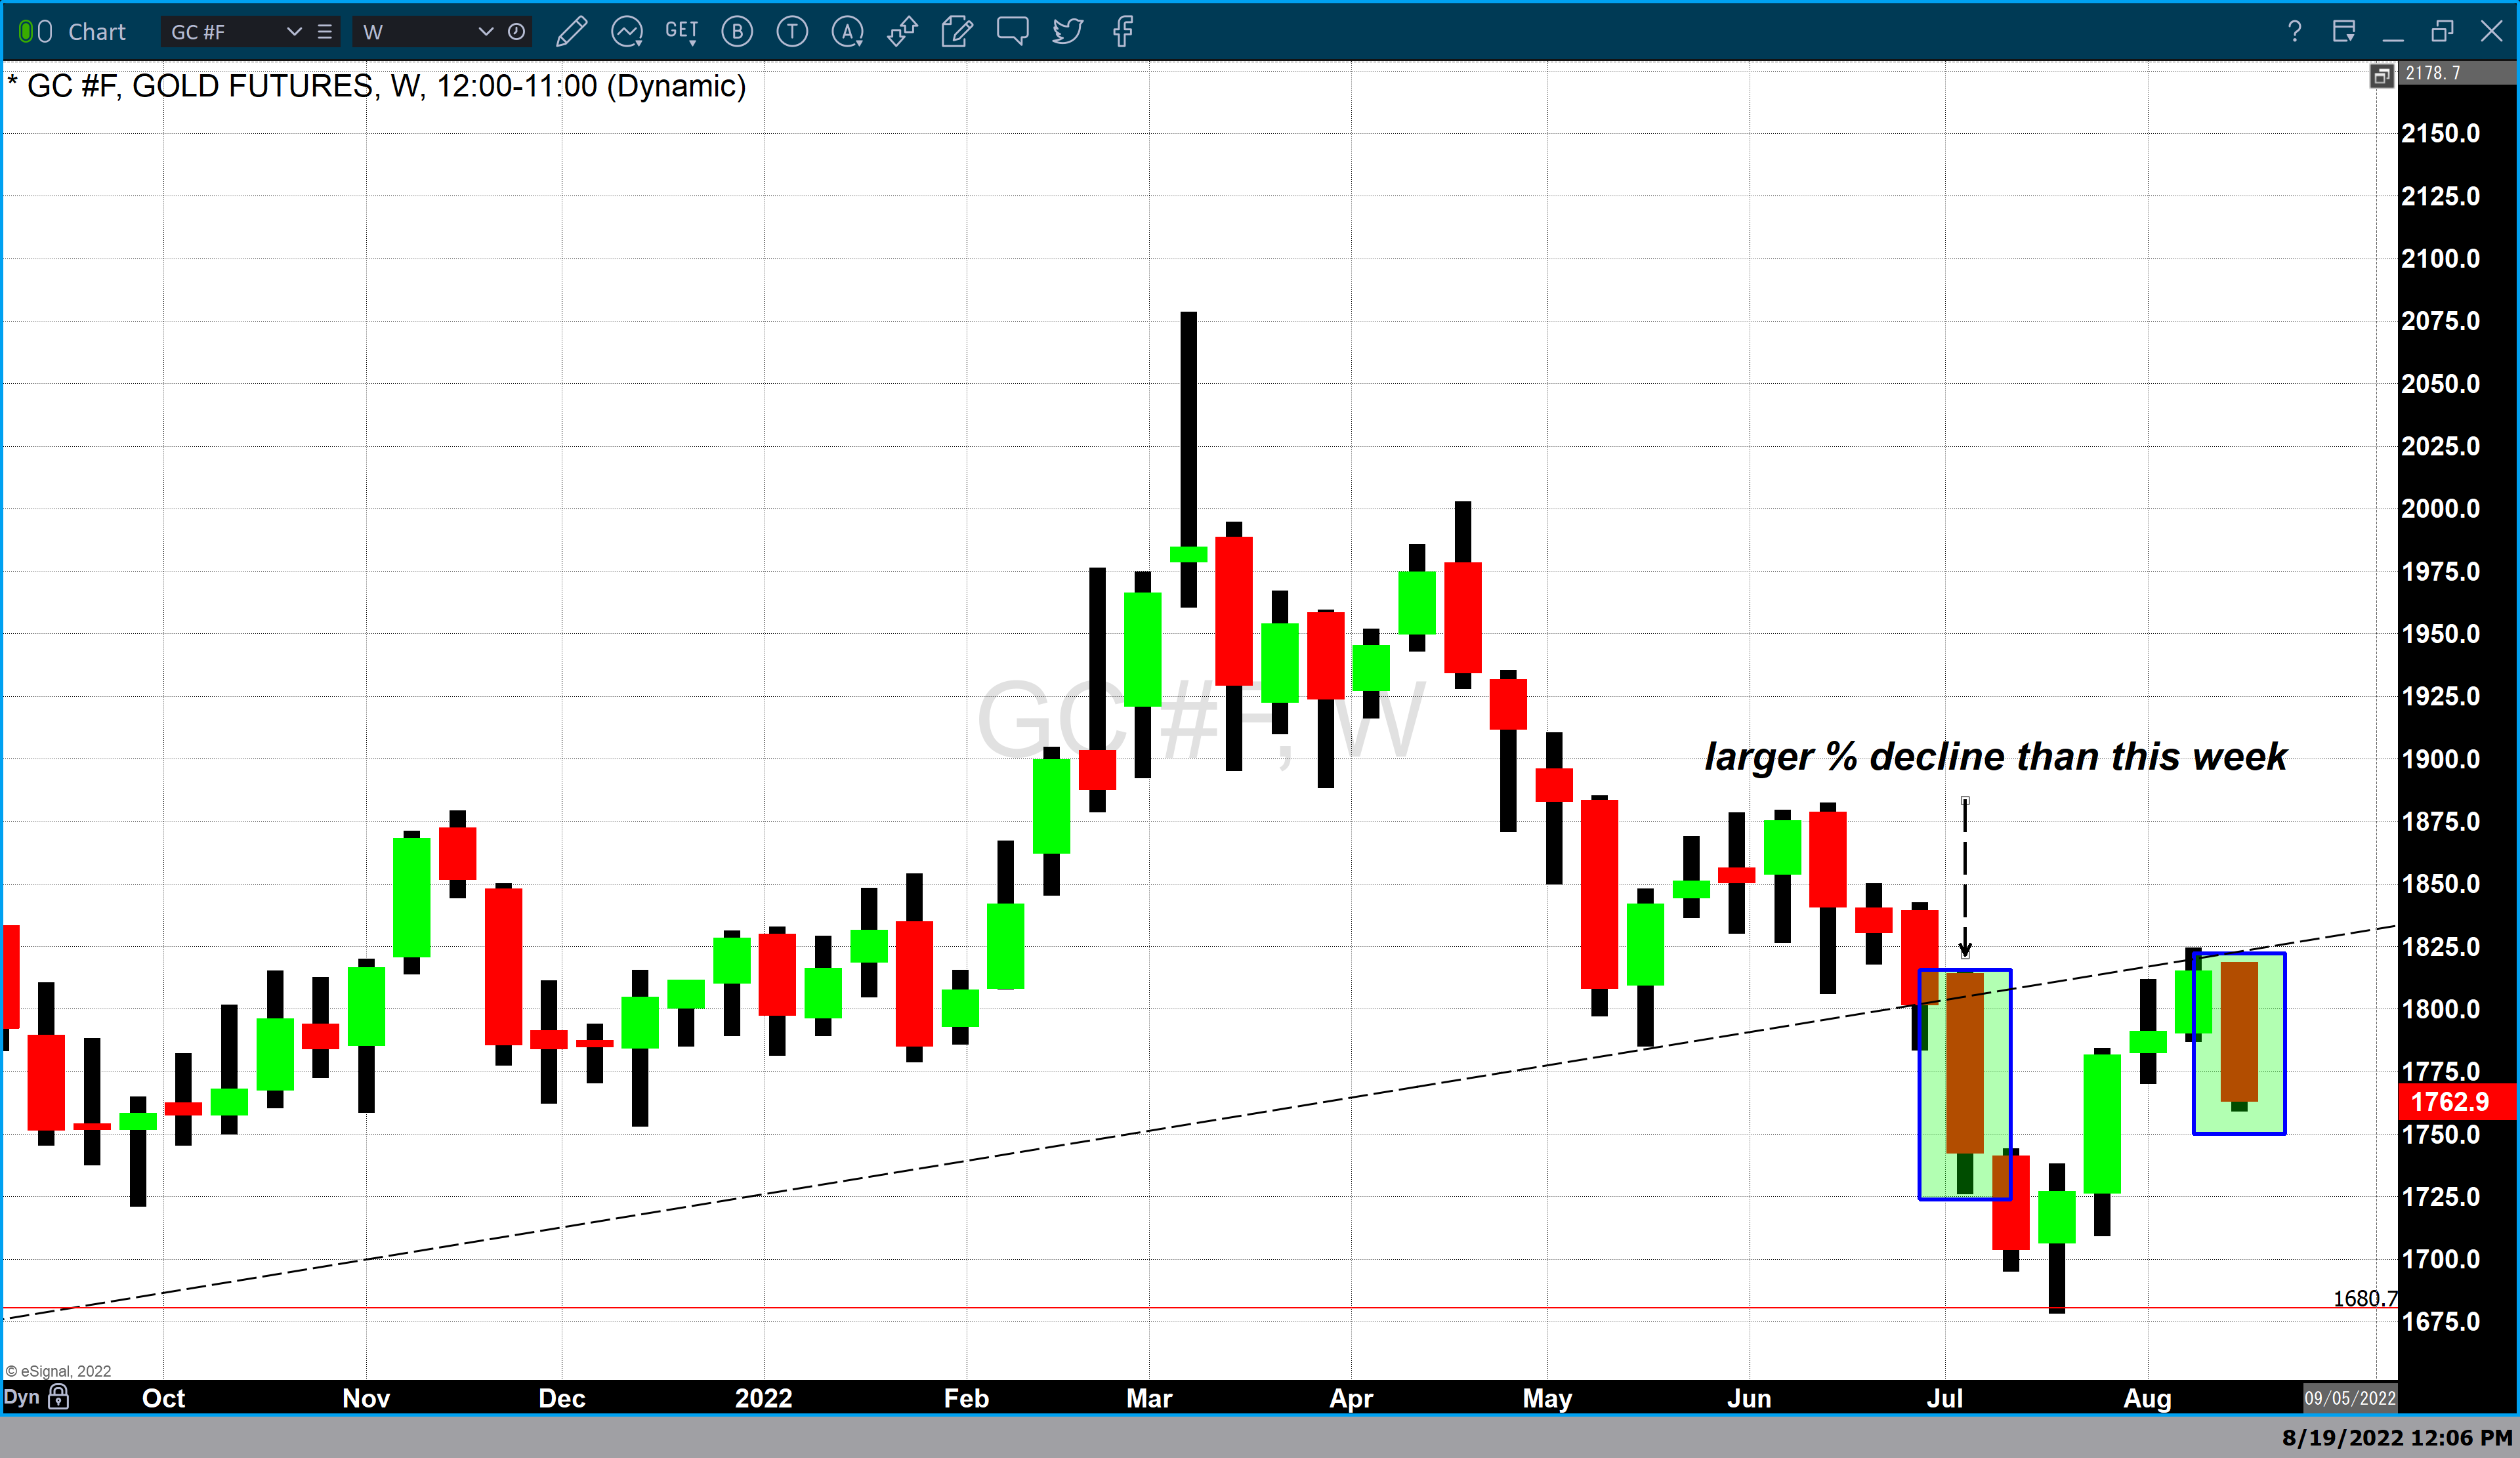
Last Monday, August 15 gold opened at approximately $1816 per ounce and scored strong price declines over the last five consecutive days, characterized by four lower highs, and four lower lows taking the most active December contract of gold futures to $1760 with under a half hour of trading before closing for the weekend.

In a single week, gold lost $56 in value. Gold sustained a price decline of approximately 3.083% over the last five trading days.

Weekly Gold Futures Chart

This is significant but certainly not extremely rare. Historically speaking we can easily identify weeks in which gold had a significant drawdown greater than this week’s price decline. Only five weeks ago, during the week of July 4 gold sustained a weekly drawdown of $71. This represents a weekly price decline of 3.861%.

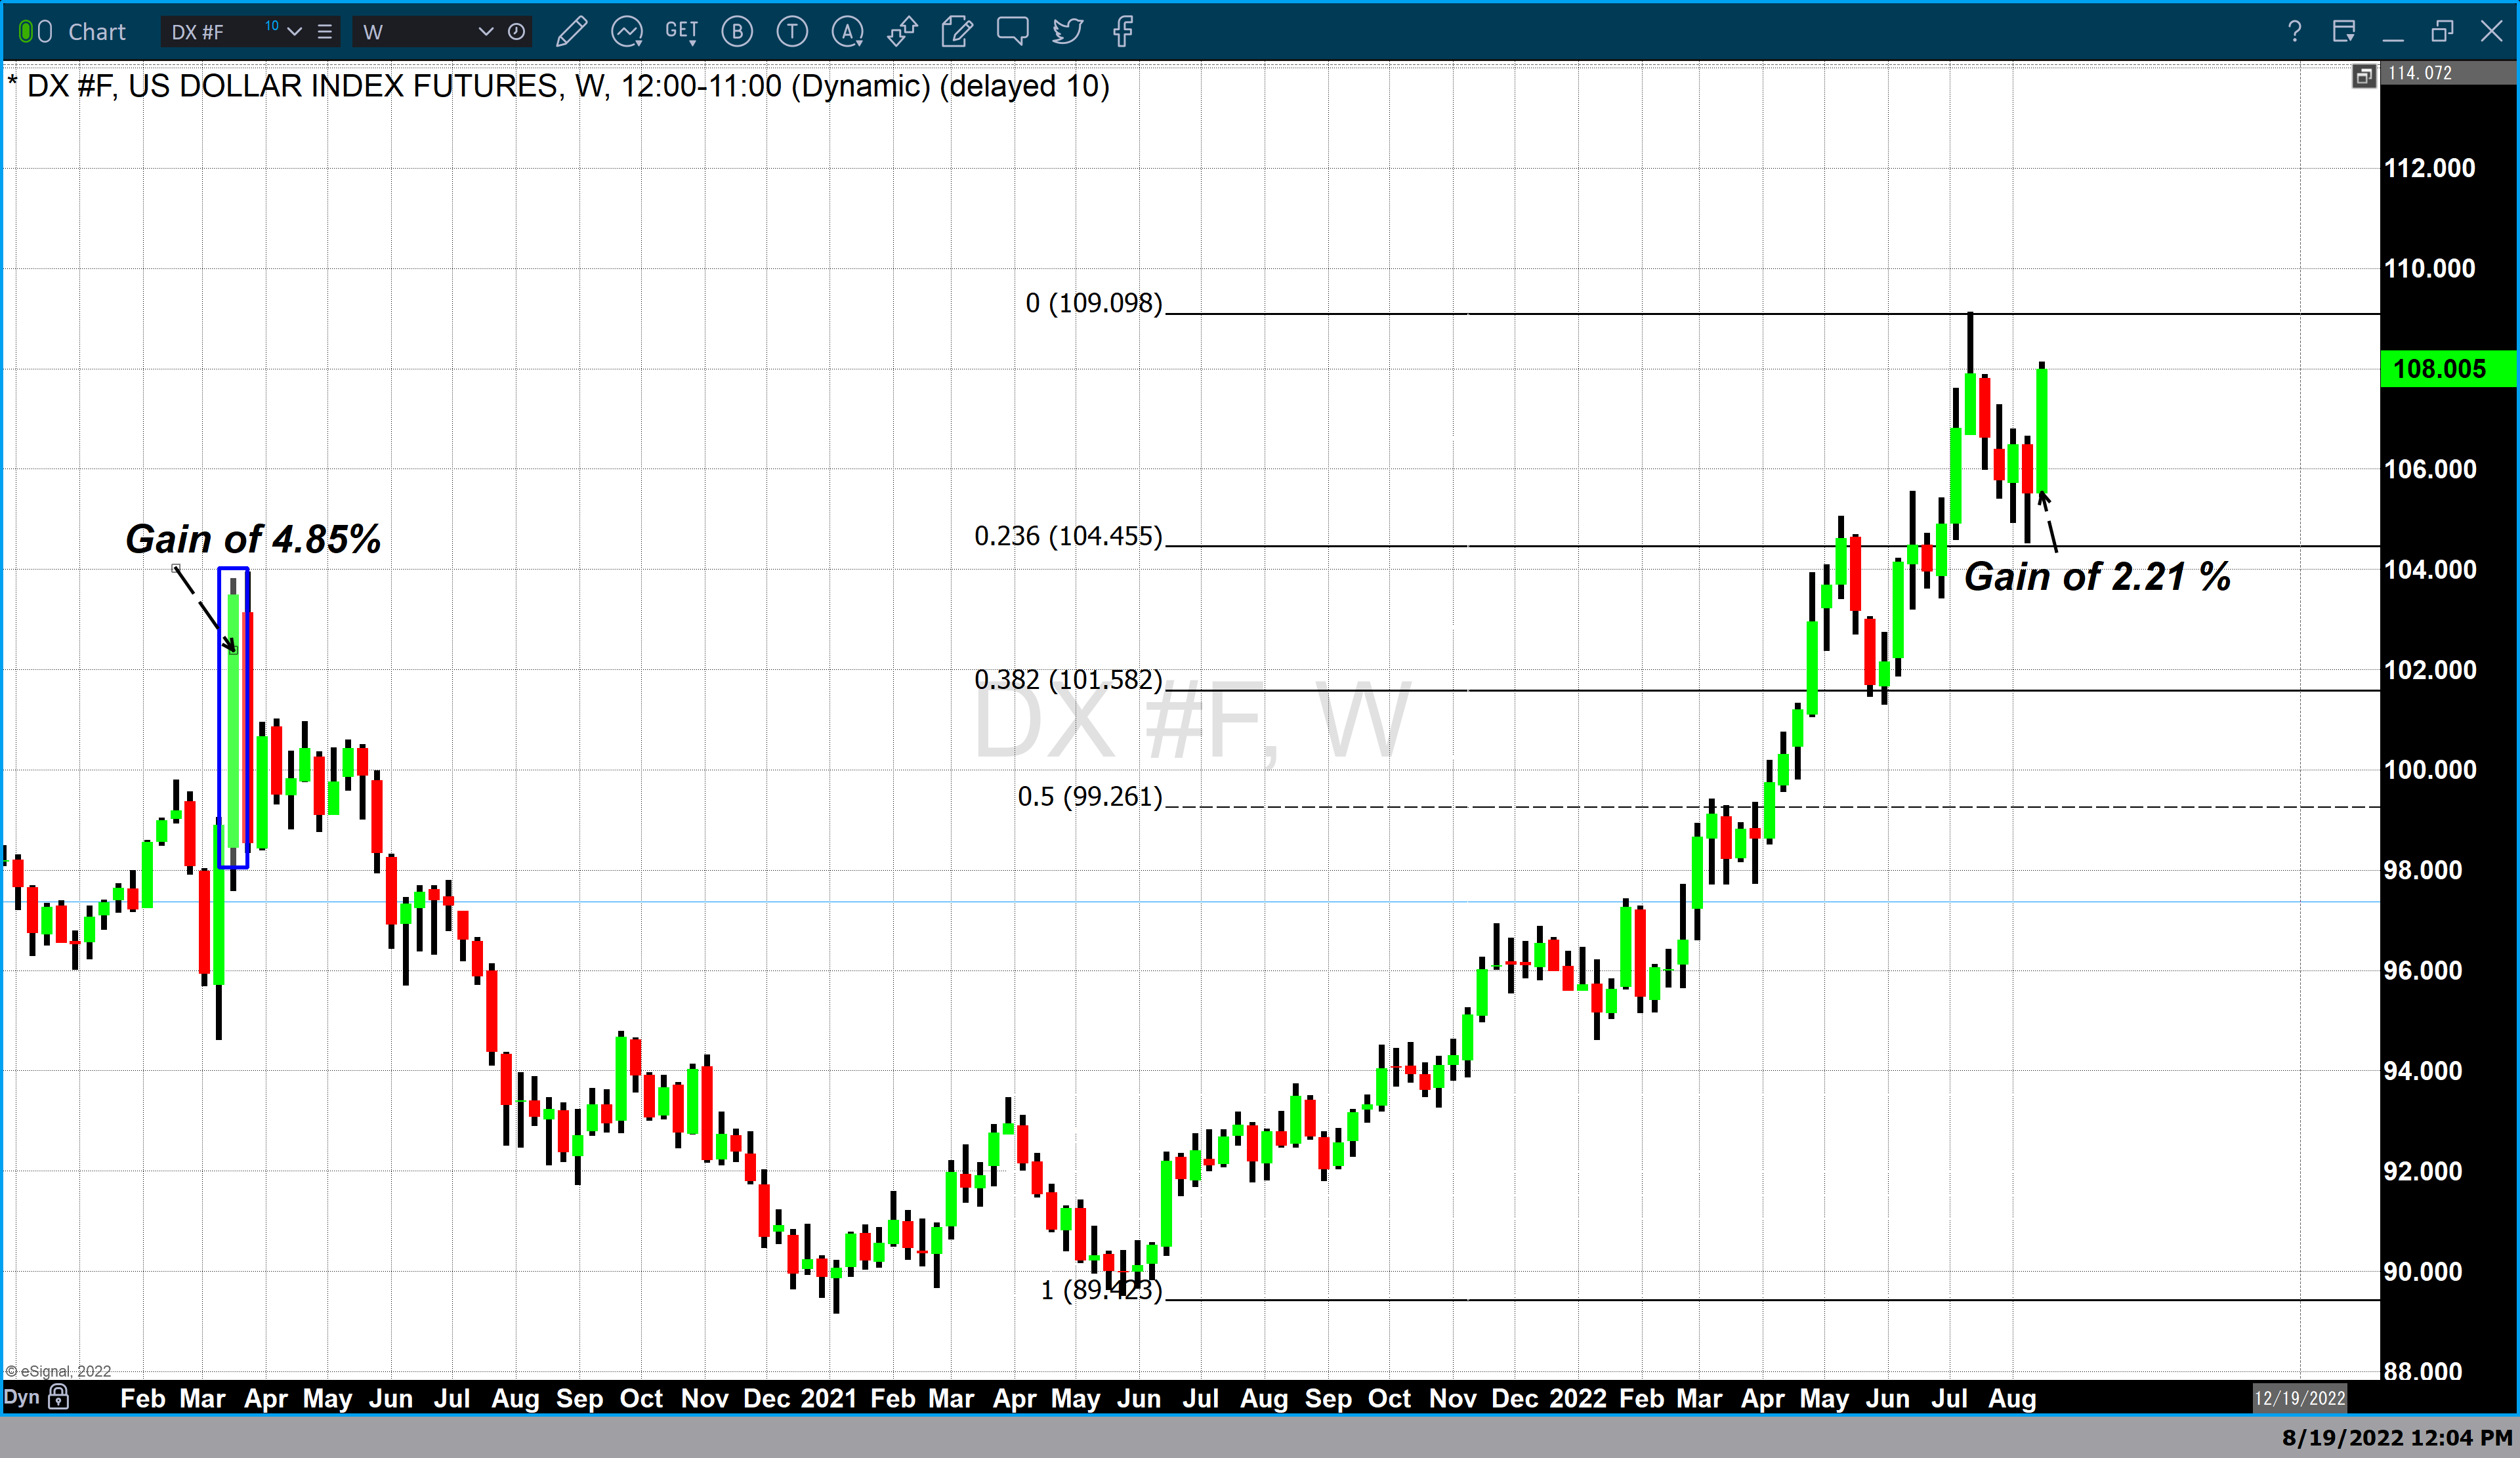
On the other hand, the gains last week in the dollar index are rare and I believe extremely significant.

Weekly DX Chart

In terms of percentage advance, gold did experience a larger percentage drop than the dollar gained. The weekly advance for the dollar index is 2.217%.

However, to identify the last instance the dollar declined this deep in a single week occurred during the week of March 16, 2020, well over two years ago. In a single week, the dollar index opened at 98.46 and closed at 103.48, a strong price advance of 502 points which is a weekly gain of 4.851% more than double last week’s gain. Continue reading "Dollar Strength VS Gold Weakness"

The Fed's Intentions

As we all know, there is a debate going on in the market about whether or not inflation has finally started to recede and therefore the Federal Reserve can start to let up on the brake pedal and — this seems a stretch — even start lowering interest rates and easing monetary policy in the near future.

Right now, those who believe the Fed is done tightening are winning the debate, witness the sharp rise in equity prices over the past two months. But at the same time several Fed officials have been warning that they are not done tightening yet — not by a long shot — and that more rate hikes are in the offing.

Notably, Minneapolis Fed President Neel Kashkari said last week that “there’s a disconnect between me and the markets,” adding that it was “not realistic” that the Fed would be lowering rates in the next six to nine months.

St. Louis Fed President James Bullard was equally blunt, telling the Wall Street Journal that he would “lean toward” another 75-basis point rate hike at the Fed’s next scheduled meeting beginning September 20. He said he expects high inflation “to prove more persistent than what many parts of Wall Street think.”

Yet many investors don’t believe them.

Does this mean that the Fed needs to make a much stronger message about its intentions, or is it content to let the market do what it wants to do and suffer the consequences if it has misjudged? Or are these investors correct in their assumptions?

Throughout his tenure, Fed Chair Jerome Powell has been not only market friendly but also keen on making sure the market understands what the Fed is up to. He doesn’t want any surprises. So does this mean that he is ok with what the market is doing, or if it’s wrong in reading the Fed, does he need to make a much clearer message?

Later this week the Federal Reserve Bank of Kansas City will host its annual Jackson Hole Economic Symposium in Wyoming. That seems like a good time for Powell to make it more crystal clear what the Fed’s intention are. Continue reading "The Fed's Intentions"

Dollar Ran Out of Time, Not Ammo

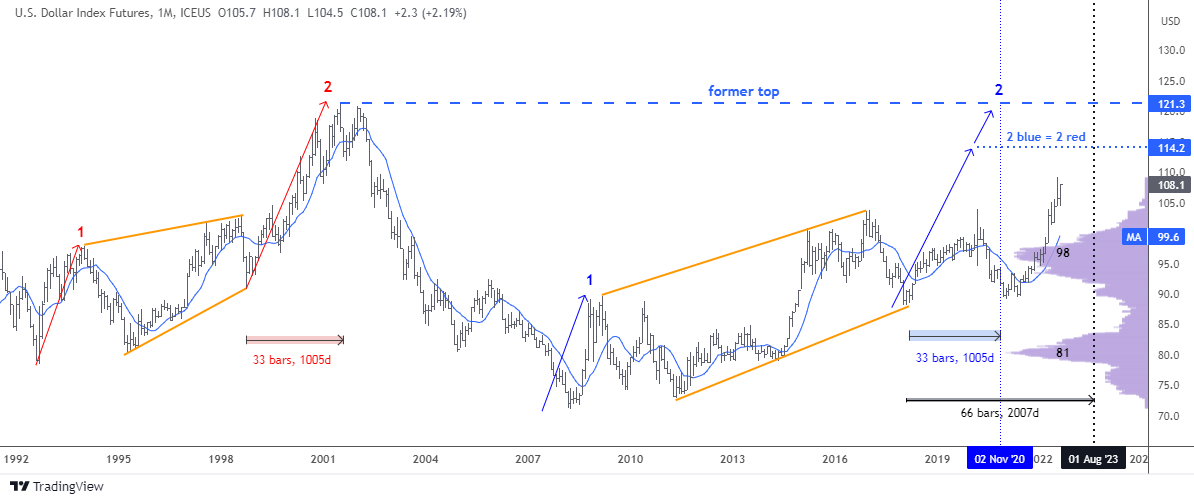
More than three years ago in my post titled, “Don't Get Trapped By Recent Dollar Weakness”, I shared with you a monthly chart of the dollar index (DX) futures with a map of large two-leg complex sideways consolidation. It was an experiment to try guessing the time target for the second blue leg to the upside based on the time it took second red leg to emerge.

Below is the updated chart with the same drawings enriched with the new highlights.

DX Futures Monthly

Source: TradingView

The time target was set on November 2020 when 33 bars in the second blue leg up emerge. The price had established the new top of $104 in March 2020 within those 33 bars. However, the minimum target of $114.2 on the price scale had not been reached and now 54 monthly bars appear on the chart.

If we divide 54 by 33 we will have the ratio of 1.64, which means the time period extended over the 1.618 Fibonacci ratio. This is a crucial time mark and last month the dollar index futures were really close to hitting the price target as it topped $109.1.

The next extension of doubling the time period with 66 bars to emerge falls on August 2023. It is enough time space for reaching both preset targets of $114.2 and $121.3.

I added two indicators on this updated chart. The purple one is the Volume Profile. It clearly has shown the strong barrier at the $98 level with the large volume traded there. When the price broke above that resistance, the speed of growth accelerated. It is the resistance being the strong support now. We should watch it closely in case the price drops there during correction.

The Simple Moving Average for the past year period is the blue line on the chart. It had accurately shown the reversal to the upside last year. The moving average confirms the support area of the Volume Profile indicator around $99.6 making it a double barrier for bears.

Three years ago the majority of readers misread the direction of the price as they bet on the drop of the dollar. Continue reading "Dollar Ran Out of Time, Not Ammo"