The Most Important Step When Saving for Retirement

A recent survey from Vanguard showed the median account balance for Americans 65 and older was just $87,700. The median amount saved by Americans aged 55 to 64 was just $89,700. The average for both age groups was much higher at $256 thousand for 55 to 64-year-olds and $280 thousand for those 65 and older.

However, these numbers are very concerning, considering these individuals are either in retirement or near retirement age and don't have enough saved up to retire.

The reality is that while the amount of money those in their 50s, 60s, and older have saved for retirement is not likely enough to give them the retirement that many of us dream about, there is not much we can do to help them at this point.

Many of the greatest investors of our time have all used the power of compounding returns to grow their vast fortunes. Warren Buffet, one of the wealthiest individuals in the world, while an outstanding investor in his own right, acquired the vast majority of his wealth late in life because of the power of compounding returns, not extraordinary investment picks.

Unfortunately, those in their 50s or older just don't have as much time on their side as is required to realize the power of compounding investment returns.

While the younger generations have more time and opportunities to grow their investment wealth, the issue is that many young people don't understand the importance of investing when young. A recent report from Morning Consult showed that half of Americans aged 18 to 34 were not yet saving for retirement, and only 39% of those who were, started in their 20s.

We often hear the same old lines from those who now wish they had saved or even just started investing earlier in life. "I was never told/taught about investing." "No one explained why investing young was crucial to growing a large investment account." "I just didn't have enough money to save when I was young/younger." There are obviously more excuses, but in my experience, these are the top three.

If you are reading this article, you care about your investments. Therefore, you either had someone explain to you the importance of investing, or you taught yourself after realizing why investing was so important. Continue reading "The Most Important Step When Saving for Retirement"

Chart Spotlight: Canadian Solar (CSIQ)

Over the last few weeks, I highlighted a few opportunities with Chart Spotlight.

  • On July 13, for example, I highlighted Generac Holdings (GNRC), as it traded around $212. It’s now up to $265.50.
  • On July 26, I highlighted Albemarle (ALB), as it traded at $224. It’s now up to $280.15.
  • On August 3, I highlighted Marathon Digital Holdings (MARA), as it traded around $13. It’s now up to $15.26, and could still move higher with Bitcoin.
  • On August 5, I spoke about Tellurian (TELL), as it traded at $3.15. It’s now at $4.35.

With the help of the screeners at MarketClub, that’s not bad at all.

Today, I'm taking a look at solar stocks, like Canadian Solar (CSIQ), which MarketClub is rating with a strong +100. Not only is this an indication of a strong long-term trend, it’s also telling us the intermediate and short-term trend is up for CSIQ, as well.

In fact according to the Chart Analysis Score, at a +100, CSIQ is in a strong uptrend that is likely to continue. With short-term, intermediate, and long-term bullish momentum, CSIQ continues to climb. MarketClub's most recent green monthly Trade Triangle occurred on August 5 at $38.18.

CSIQ Chart With Trade Triangles

Source: MarketClub

Continue reading "Chart Spotlight: Canadian Solar (CSIQ)"

Look For Pullbacks In These 2 Retail Stocks

It’s been a roller coaster ride of a year for investors, with the S&P-500 (SPY) finding itself down more than 20% year-to-date in one of its worst starts ever before clawing back following a slight deceleration in CPI sequentially (8.5% vs. 9.1%).

One of the hardest hit groups this year has been the Retail Sector (XRT), with a considerable portion of the sector suffering when consumers adjust their spending habits.

While this has led to some investors steering clear of the sector, some names tilt more towards staples than their peers, like Walmart (WMT), and some discretionary names have seen large enough corrections that a harder-than-expected landing for the economy looks mostly priced in.

One stock that fits the second bill is American Eagle Outfitters (AEO), which is down over 65% from last year’s highs even after its recent rally.

While I wouldn’t be in a rush to buy either name with the market short-term extended, I believe they belong at the top of one’s watchlist if they pull back towards support. Let’s take a look below: Continue reading "Look For Pullbacks In These 2 Retail Stocks"

ETFs That Track Retail Investing Trends

Over the past few years, retail investors have shown they have the power (money) to take stock prices to 'the moon' if they operate as a group.

Last year it was GameStop (GME) and AMC (AMC).

Just a few weeks ago, it was AMTD Digital Inc (HKD), which was IPO'd in July and has had a trading range of $13.52 per share up to $2,555.30 per share since the initial public offer. HKD is currently trading in the low $200 range.

But just because retail investors can do something, does that mean they should? Are the retail crowd good stock pickers? And should you follow their lead?

At this time, we don't know the answer to these questions. That is because we don't have enough data on whether or not retail investors operating as a whole are good stock pickers. They have only really been flexing their muscle for a little more than a year.

Plus, when they started with GME and AMC, we were still in a bull market. But now, we are in a bear market. So it would be unfair to say the retail investor's recent performance shows their lack of sophistication and that they don't belong picking stocks.

A few Exchange Traded Funds track what retail investors are talking about on social media or buying in their brokerage accounts, and as of late, retail investor stock picks are not outperforming the market.

The VanEck Social Sentiment ETF (BUZZ), which tracks the top 75 companies with the most popular sentiment online based on a proprietary AI model to select stocks, is down 32% year-to-date.

The SoFi Social 50 ETF (SFYF), which tracks the 50 most widely held stocks in self-directed brokerage accounts of Sofi Securities, is down 25.55% year-to-date.

And the FOMO ETF (FOMO), which invests in the areas of the market that are currently in favor with retail and individual investors or currently 'trending,' is down 17.94% year-to-date. Continue reading "ETFs That Track Retail Investing Trends"

Gold And Silver: Is It A Trap?

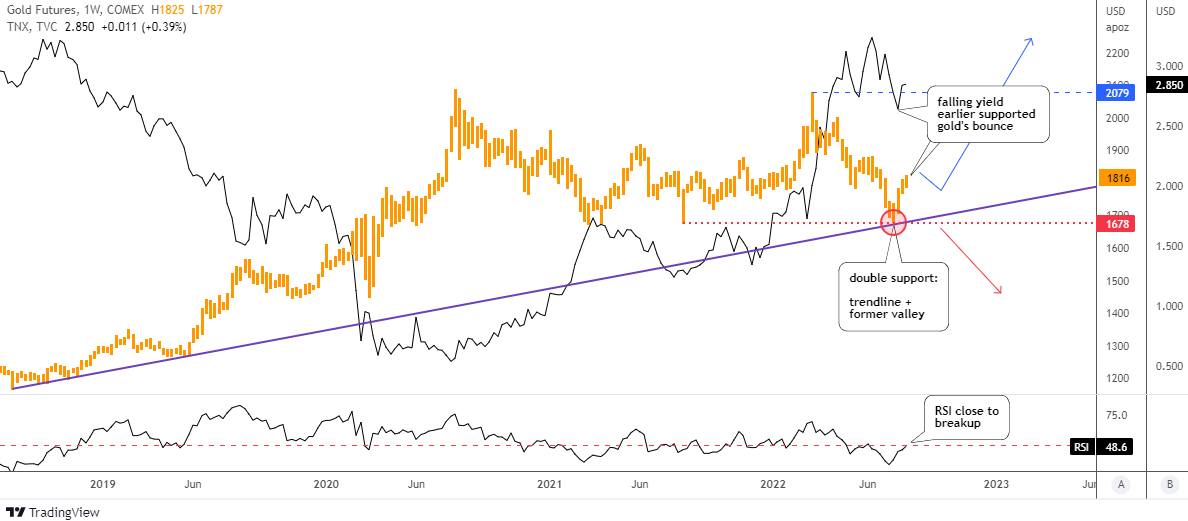
Back in June, I shared with you an alternative scenario for gold with a downside trigger on the trendline support.

I highlighted it with a purple color in the weekly gold futures chart below. This area is fortified with the red horizontal trendline based on the former valley of $1,678. Though, it’s a double support level.

Gold Futures Weekly

Source: TradingView

It is amazing how accurately the price bounced off that strong support. The metal took its chance to jump to the upside amid the falling yield of 10-year U.S. government bonds (10Y).

The easing inflation data limits the hawkish expectations on the Fed rate hikes. Though, the 10Y’s advance has been paused as the market took some gains amid uncertainty.

However, the real interest rate is still strongly negative at -6%. The labor market shows vitality according to statistics. This leaves the room for the Fed to keep tightening until something breaks down.

The 10Y bounced off recently from 2.6% to 2.85% and nobody knows if it’s a continuation or a consolidation.

The gold market has been trapped with the whole uncertainty as it has built a large sideways consolidation since August 2020. Continue reading "Gold And Silver: Is It A Trap?"