Single Stock ETFs Are Here

In July, AXS Investments debuted US-based investors' first single stock Exchange Traded Funds. These ETFs allow investors to gain leverage on certain individual stocks.

However, because you are using leverage, there is more risk involved, and the authorities want investors to understand these risks before purchasing these new products.

The risks are associated with the leveraged exposure these new ETFs offer and the risk associated with investing in individual stocks. But since leverage is being applied, the risk level multiplies.

For example, one of the new ETFs being offered is the AXS 2X NKE Bull Daily ETF (NKEL) which provides investors 2X leverage to Nike (NKE) stock. This would mean that if you owned NKEL on a day when Nike stock increased by 0.50%, the NKEL ETF, which is 2X leverage, will go up 1.00%.

But, the opposite is also true. So if Nike stock fell by 1%, the NKEL ETF, which tracks Nike stock at a 2X leveraged ratio, would lose 2%.

Leverage is a very nice thing to have when it is being applied in the direction you want it to move. But leverage can be deadly when it is going against you.

Hence why the Securities and Exchange Commission is warning investors of the dangers associated with any single stock ETF, even if it is not marketing itself as leveraged.

One example of a new single stock ETF that is not marketing itself as leveraged is the AXS TSLA Bear Daily ETF (TSLQ). This ETF only tracks Tesla, but to the downside with just 1X leveraged exposure.

This essentially means that the TSLQ is shorting Tesla. But, unlike having to short a stock, which would require approval from your broker, a margin account, and the risk of not losing more than 100% of your investment, you simply have to buy this one ETF and not worry about the other things. Continue reading "Single Stock ETFs Are Here"

Which Is The Better Restaurant Stock?

It's been a volatile year for the restaurant industry group (EATZ), which found itself down over 29% for the year before its recent recovery. This rebound can be attributed to hopes that inflation has peaked combined with short covering, with the small-cap and mid-cap restaurant names having elevated short interest relative to other industry groups.

Following this rally, some investors might be looking for names that haven’t participated in the recovery. However, underperformance is often related to underlying problems with a business, so it's essential to look at industry trends, sales performance, and other key metrics to ensure one isn't buying into a value trap.

In this update, we’ll look at two restaurant brands with above-average short interest and see which is the better stock to own - Restaurant Brands International (QSR) or Red Robin Gourmet (RRGB).

Scale, Business Model & Unit Growth

From a scale standpoint, Restaurant Brands International (“RBI”) and Red Robin differ materially. RBI has more than 29,000 restaurants under four different brands (Burger King, Tim Hortons, Firehouse Subs, Popeyes Chicken), and Red Robin has 525 restaurants under one brand: Red Robin Gourmet Burgers.

Typically, the smaller-scale company would be the more attractive one assuming it was a high-growth concept and a similar business model. However, Red Robin is inferior in both categories.

Not only has Red Robin seen its store count decline by 10% over the past three years while RBI’s store count has increased 15%, but Red Robin operates a casual dining concept, and its brand is nowhere near as iconic as RBI’s top-rated brands in the coffee, burger, and chicken category, which are Tim Hortons, Burger King, and Popeyes, respectively.

Meanwhile, only 20% of Red Robin’s system is franchised vs. 100% for RBI, meaning that Red Robin is much more sensitive to inflationary pressures, seeing a sharp decline in earnings when it's seeing food and labor costs rise. Continue reading "Which Is The Better Restaurant Stock?"

Has the Fed Already Whipped Inflation?

To hear Jeremy Siegel tell it, the Federal Reserve has already won its fight over inflation and should start taking its foot off the monetary brakes.

“I think the Fed should be near the end of its tightening cycle,” the ubiquitous market prognosticator and Wharton School finance professor told CNBC last week. According to Siegel, current headline inflation may still be high, “but forward-looking inflation has really been stopped. And I think the Fed should really slow down the rate of hiking, and if we get a snapback in productivity that’ll put further downward pressure” on inflation.

Is he right, or is it just wishful thinking so stocks can resume their decade-long winning streak?

Right now the signals look mixed, based on the two most important and widely-followed economic reports issued last week.
According to the Commerce Department, second quarter GDP fell 0.9% at an annual rate, on top of the prior quarter’s 1.6% decline.

Until this year, the mainstream media would have immediately pounced on that as clear evidence that we are officially in a recession, following the traditional definition of a downturn as two back-to-back negative quarters. Now, however, with a feckless president poised to lead his party to an election Armageddon in November, we learn that the old standard simply doesn’t apply anymore, so we can’t use the dreaded “R” word.

Whether that’s pure bias or pure something else that also begins with a B, July’s robust jobs report, which showed the economy added a much higher than expected 528,000 jobs, does create some doubt whether we are in a recession or not, and if so, what the Fed plans to do about it.

Instead of viewing the jobs report as good news being bad news – i.e., the Fed will need to continue tightening to stifle economic growth—and sell stocks, the market instead went up on Friday and continued to rally on Monday morning. Is the recession – if there ever was one – now officially over, the inflation monster slain and no further need for the Fed to continue to raise interest rates? Continue reading "Has the Fed Already Whipped Inflation?"

Strong Jobs Report Abates Fears of Recession

Last week, the jobs report was released. Economists were expecting an additional 258,000 new jobs added last month. The Labor Department’s report revealed that the U.S. economy has had robust job growth last month adding over 500,000 jobs in July.

The exceedingly strong numbers of the report diminished concerns about the United States entering a recession. While this optimistic report bodes well for economic growth, it certainly does not address inflation.

However, it does change market sentiment which had been intensely focused on the last two GDP reports. On July 28 the government released the advance estimate of the second quarter GDP. The report revealed that the GDP had decreased at an annual rate of 0.9% during the second quarter of 2022.

Earlier this year the BEA reported a decrease in the first quarter GDP of 1.6%. The widely accepted definition of a recession is an economic contraction over two consecutive quarters. Continue reading "Strong Jobs Report Abates Fears of Recession"

Crypto Update: It Ain't Over Yet

It was a close call this May with a doom-saying title “Crypto Apocalypse?” where I shared with you an annihilating model for Ethereum and a bearish chart of Bitcoin.

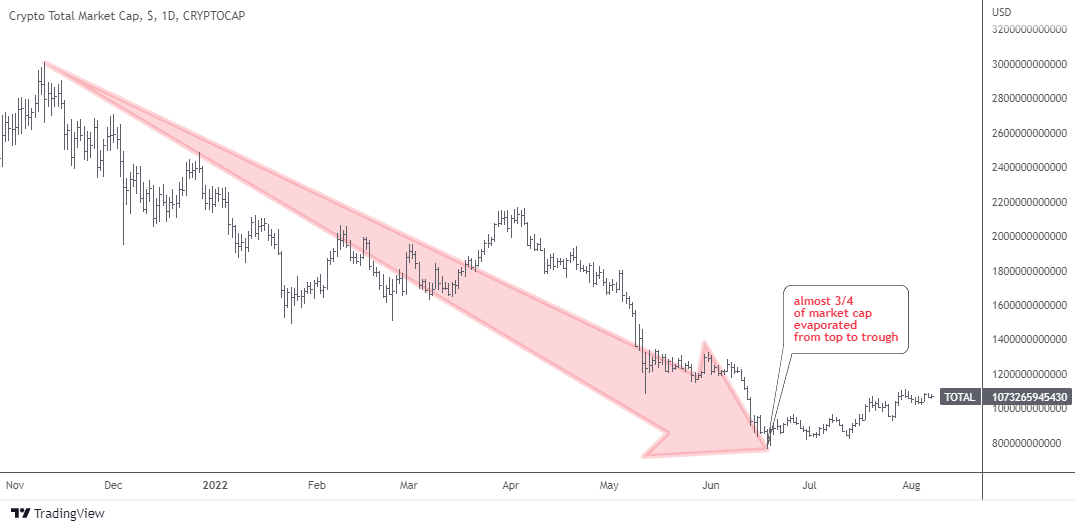
Let us see what happened in the crypto market since then in the chart below.

Crypto Total Market Cap

Source: TradingView

Total crypto market cap had skyrocketed to the maximum of just over $3 trillion last November. Since then, almost ¾ of the total market cap has evaporated on the crypto crash down to $762 billion this June. That hurts!

More than $2 trillion of wealth was destroyed during that collapse. Some people were calling it a “crypto-winter” of the market. All of us have probably noticed that less videos and posts with clickbait titles on “how to become a crypto-millionaire” or new rising stars in the crypto-market have been popping up on social media lately.

In the next market share chart, let's check the status quo of the market leaders.

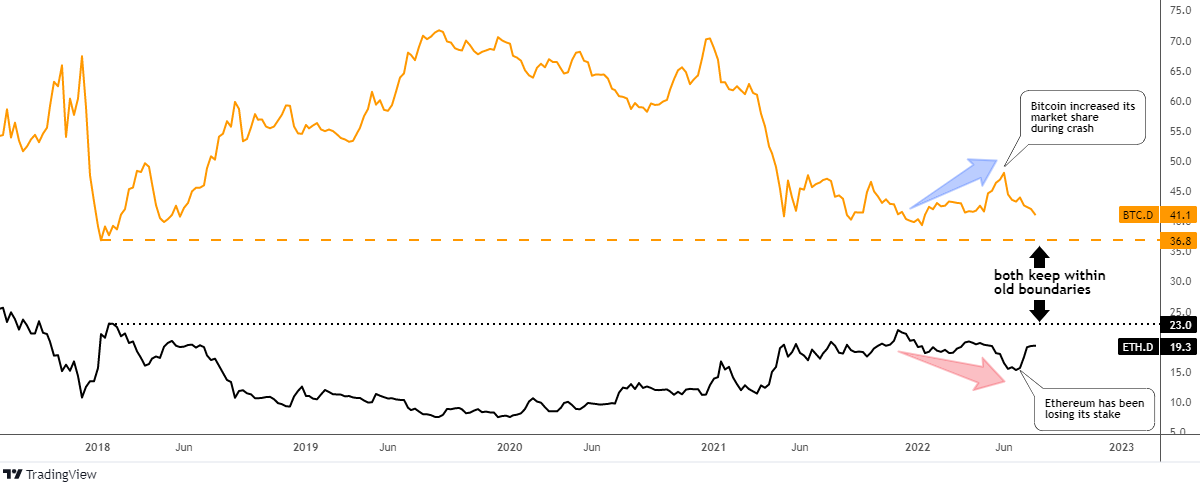
BTC ETH Dominance

Source: TradingView

During the collapse of the market, the main coin (orange) has managed to increase its market share tremendously from 40% up to 48% on the peak in June. How could that happen as it was bleeding alongside the whole market? The speed of the drop is the main reason. Continue reading "Crypto Update: It Ain't Over Yet"