Golden Opportunity for These 3 Mining Stocks

It’s been a tough year for investors in the Gold Miners Index (GDX), with the ETF shedding 38% of its value since its April highs.

It’s been a tough year for investors, with the ETF shedding more than 45% from its multi-year highs. A gold price decline exacerbated this tumble. For the weakest producers, this is a concern.

While this has led to many investors steering clear of the sector, some miners are now at their lowest multiples since the 2015 bear market bottom, when margins were half what they are today. Many miners were carrying considerable amounts of debt.

Today, this same group of producers will enter Q4 2022 in net cash positions, are paying out dividends double that of the S&P-500 (SPY), and are much more disciplined, learning from past mistakes. To summarize, I see this as a rare opportunity to buy a few high-quality businesses.

Let’s take a look at three stand-out names below: Continue reading "Golden Opportunity for These 3 Mining Stocks"

Here's Another Crisis the Fed Can Fix

Now that the geniuses at the Federal Reserve are on their way to engineering a soft landing — taming inflation while avoiding a recession — maybe their next task should be trying to fix the U.S. retirement system.

For the past year or so I have been bombarded with phone calls, emails and regular junk mail to sign up for Medicare, and this past weekend I finally reached the American Holy Grail: Medicare eligibility. It used to be Social Security, but with medical insurance so outrageously expensive Medicare has become the ultimate goal. 

Over this time I've found out the difficulties of trying to maneuver through this vast labyrinth of government benefits. Let me tell you, it ain't easy, so prepare yourself when it’s your time. 

How the government ever came up with this plan, I’ll never know, unless its intention was to deliberately confuse the heck out of its oldest citizens and to create a whole industry to help people navigate it. In that it has succeeded.

The first thing you need to know is that Social Security and Medicare are joined at the hip, but not exactly. While you’re eligible for Social Security starting at 62, you have to wait until 65 before you can sign up for Medicare, which again, is the more important of the two, unless you’re lucky enough to have your medical insurance covered by someone else, like your employer. For the vast majority of everyone else, however, Medicare is a critical benefit.

Maybe Bernie Sanders’ idea of Medicare-for-all isn’t such a great idea, but at least the two should start at the same time, just to avoid confusion.

First there’s the question of when to start taking Social Security. While you can start taking benefits as early as 62, you don’t reach your “full” payout until later, depending upon when you were born. For those born in 1957, you reach “full” retirement age at 66 and 6 months; add another six months if you were born in subsequent years.

Now, don’t confuse “full” retirement age with your “maximum” Social Security benefit, which occurs when you turn 70.

Confused yet? I’m just getting warmed up.

Most of the advice you hear about when to start taking Social Security is that you should wait until you reach your “full” benefit or, better yet, your “maximum” benefit. That’s because benefits rise by about 8% a year between 62, when you’re eligible to collect, and beyond. And the difference is indeed meaningful. For example, if you start collecting when you’re 62, rather than 66 ½, your monthly benefit will be reduced by $725, or 27.5%. Now that’s every month for the rest of your life.

While it may indeed be more financial advantageous to wait for the bigger payout, the fact is lots of people can’t – they need the money now. In fact, about a third of eligible recipients start collecting as soon as they can, at 62.

Waiting to collect isn’t always the best advice. If you believe you have a short life expectancy, either because of your lifestyle, family medical history, or both, it may be wise to start collecting early.

You also need to consider the amount of money you will forgo by waiting until “full” or “maximum” retirement age – that’s a lot of monthly payments you’ll be missing. In fact, the breakeven point between the two occurs around age 78, so if you don’t think you’ll live to see that, it may be wise not to wait to start collecting.

Now let’s get back to Medicare, whose rules are just as complicated.

There are several parts to Medicare. Part A, which covers hospitalization, is free. Yes, you heard that right - FREE.

The most expensive medical expense you can probably face is spending a night in the hospital, which Medicare estimates costs an average $13,600. And yet that coverage is free. I kid you not.

Part B covers your doctor visits, but there is a fee for that, which comes directly out of your Social Security payment. You are automatically enrolled in both Part A and B when you start collecting Social Security (I told you they were joined at the hip).

Part D covers your medicines, but not all the drugs you take are covered by Medicare (neither are dentistry, eyecare, and hearing aids, i.e., the stuff you really need when you’re old). There’s a fee for this, too.

Which brings us to Medicare “supplemental” insurance and “advantage” plans, which sound the same but are completely different. You’ve probably heard about them on TV.

As the name implies, supplemental insurance — which you also have to pay extra for - picks up some of what Medicare doesn’t cover (see above).

Advantage plans, by contrast, largely take the place of Medicare, but their premiums and coverages range all over the place. In case you were wondering, Advantage plans are also known as Medicare Part C.

I failed to mention that Social Security and Medicare make up the lion’s share of the federal budget and run out of money every few years, at which time Congress has to “fix” them to make them appear solvent for a while, which usually means making them even more complicated.

So maybe the Fed is the right place to seek a solution. It seems to solve just about all our other financial problems.

George Yacik
INO.com Contributor

Disclosure: This article is the opinion of the contributor themselves. The above is a matter of opinion provided for general information purposes only and is not intended as investment advice. This contributor is not receiving compensation (other than from INO.com) for their opinion.

Gold Bug Survivors Prepare to Capitalize

It has been a classic washout in the gold stock sector, but if positioned correctly opportunity is setting up.

  • The ‘macro’ and sector fundamentals have been incomplete.
  • The technicals have advised a downtrend since mid-2020 with the exception of one head fake in March-April, 2022.
  • Sentiment, which was over-bullish in mid-2020 and April 2022 is now opposite, and very bullish on a contrarian basis.
  • The sector is deeply oversold as evidenced by an extreme in the Gold Miners Bullish Percent Index (BPGDM).
  • Commitments of Traders data for gold and silver are positive and very positive, respectively on a contrarian basis.
  • As has been proven by the facts of recent history, the view of cyclical (as opposed to ‘stag’) inflation being terrible for gold stocks was correct, even as this view was lost in the din of opposing – and tragically wrong – opinions by heavily followed Twitter ‘influencers’ and other dignitaries.

So here we are, intact.

What have you done for me lately, smart guy? Err, not much. There has been a lot of waiting, biding time, trading other areas and sitting on cash; a high percentage of it.

But as speculators, traders and/or investors are we not called upon to never set our views in stone? Are we not called upon to be ready to capitalize on extreme events within the markets? When the herds run one way we need to be ready to go the other. The herds are not prepared because they’re either already deployed or too busy running from losing positions.

Gold bug herds, AKA less experienced or analytically critical precious metals bulls, are currently running that way, over that cliff over there. They have been herding since August 2020, when we first noted the danger.

Such events climaxed in 2008 and 2020 too. In each of those instances a crash took place and it coincided with fundamentals slamming into place. Crashing gold stocks + ramping fundamentals = big time buy opportunity.

As noted in the first bullet point above, the fundamentals have not slammed into place on this cycle. They are grinding into place, slowly and outside the limits of the average market participant’s patience. But that is exactly why contrarian investing is so difficult. It is very hard to have patience when time takes what it takes for an opportunity to play out, especially when your viewpoint is not reinforced by a majority.

So that is the background. We have been more than prepared in managing risk. That is how markets often go… manage risk > manage risk some more > manage risk for so long you almost lose sight – in real time – of why you’re there and what your job is > and then PREPARE TO CAPITALIZE.

Intact players should now be considering the big sentiment event on tap for next week as the Fed, which was jerked kicking and screaming into hawk mode by the bond market, prepares to render its big decision (on July 27 they will either hike the Fed Funds by .75% per 71% of CME traders or 1% per 29% of CME traders).

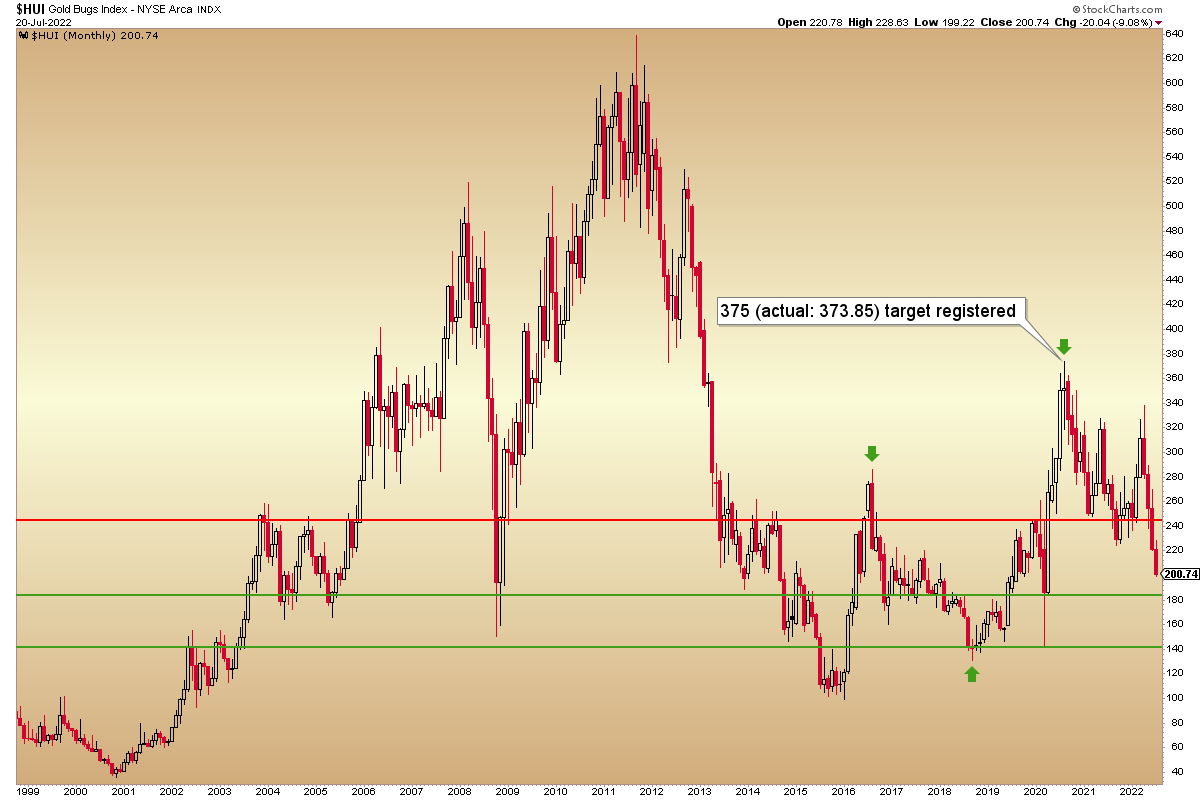
Meanwhile, the Gold Bugs index is tanking toward a higher low to the 2018 low, which is really all it needs to do to keep the volatile series of higher highs and higher lows (AKA a bull market) intact.

I use shorter-term charts and of course the ‘macro’ and sector fundamentals and sentiment to fine tune the situation, but this general monthly chart picture should not only cause no concern for would-be buyers who are well prepared; it should stimulate greed while a majority of bugs are gripped in fear.

Gold Bugs Index Chart

Source: StockCharts.com

Gary Tanashian

For “best of breed” top-down analysis of all major markets, subscribe to NFTRH Premium, which includes an in-depth weekly market report, detailed market updates, and NFTRH+ dynamic updates and chart/trade setup ideas. Follow via Twitter @NFTRHgt.

Chart Spotlight: Albemarle Corp. (ALB)

Governments all over the world are pushing for a greener future.

The U.S. wants to cut emissions by up to 52%. Europe says it’ll cut emission by up to 55%. China says it will stop releasing CO2 in the next 40 years.

To help, leaders want millions of zero-emission electric vehicles on the roads as of yesterday.

The International Energy Agency (IEA) estimates we could see 135 million EVs in the next 10 years. Analysts at Ernst & Young say EV sales could outpace combustion engines in Europe, China, and the U.S. in the next 12 years.

There’s just one problem.

Every electric vehicle requires 22 pounds of lithium - the main ingredient in rechargeable batteries and energy storage devices.

Unfortunately, we don’t have enough supply to meet demand.

In fact, according to Investing News, “With sales of electric vehicles expected to continue to surge in key markets, demand for lithium is forecast to grow exponentially, and if there’s one thing producers agree on is that more supply is needed. Figures as to how much output will be required vary slightly, but the speed at which the industry has to scale up to reach those levels is unprecedented.”

That being said, I expect to see higher highs for lithium prices, and for related stocks, like Albemarle Corp. (ALB), the industry’s 800-pound gorilla.

Fundamentally, ALB is undervalued, trading with a PEG ratio of just 0.50. With lithium demand only rising, I don’t expect for ALB to remain undervalued for long.

Plus, the company recently raised its guidance twice. In May, for example, the company raised its forecast for the full-year, noting it expects for 2022 sales to come in between $5.8 billion and $6.2 billion. Adjusted EBITDA is now expected to come in between $2.2 billion and $2.5 billion, with adjusted EPS of between $9.25 and $12.25.

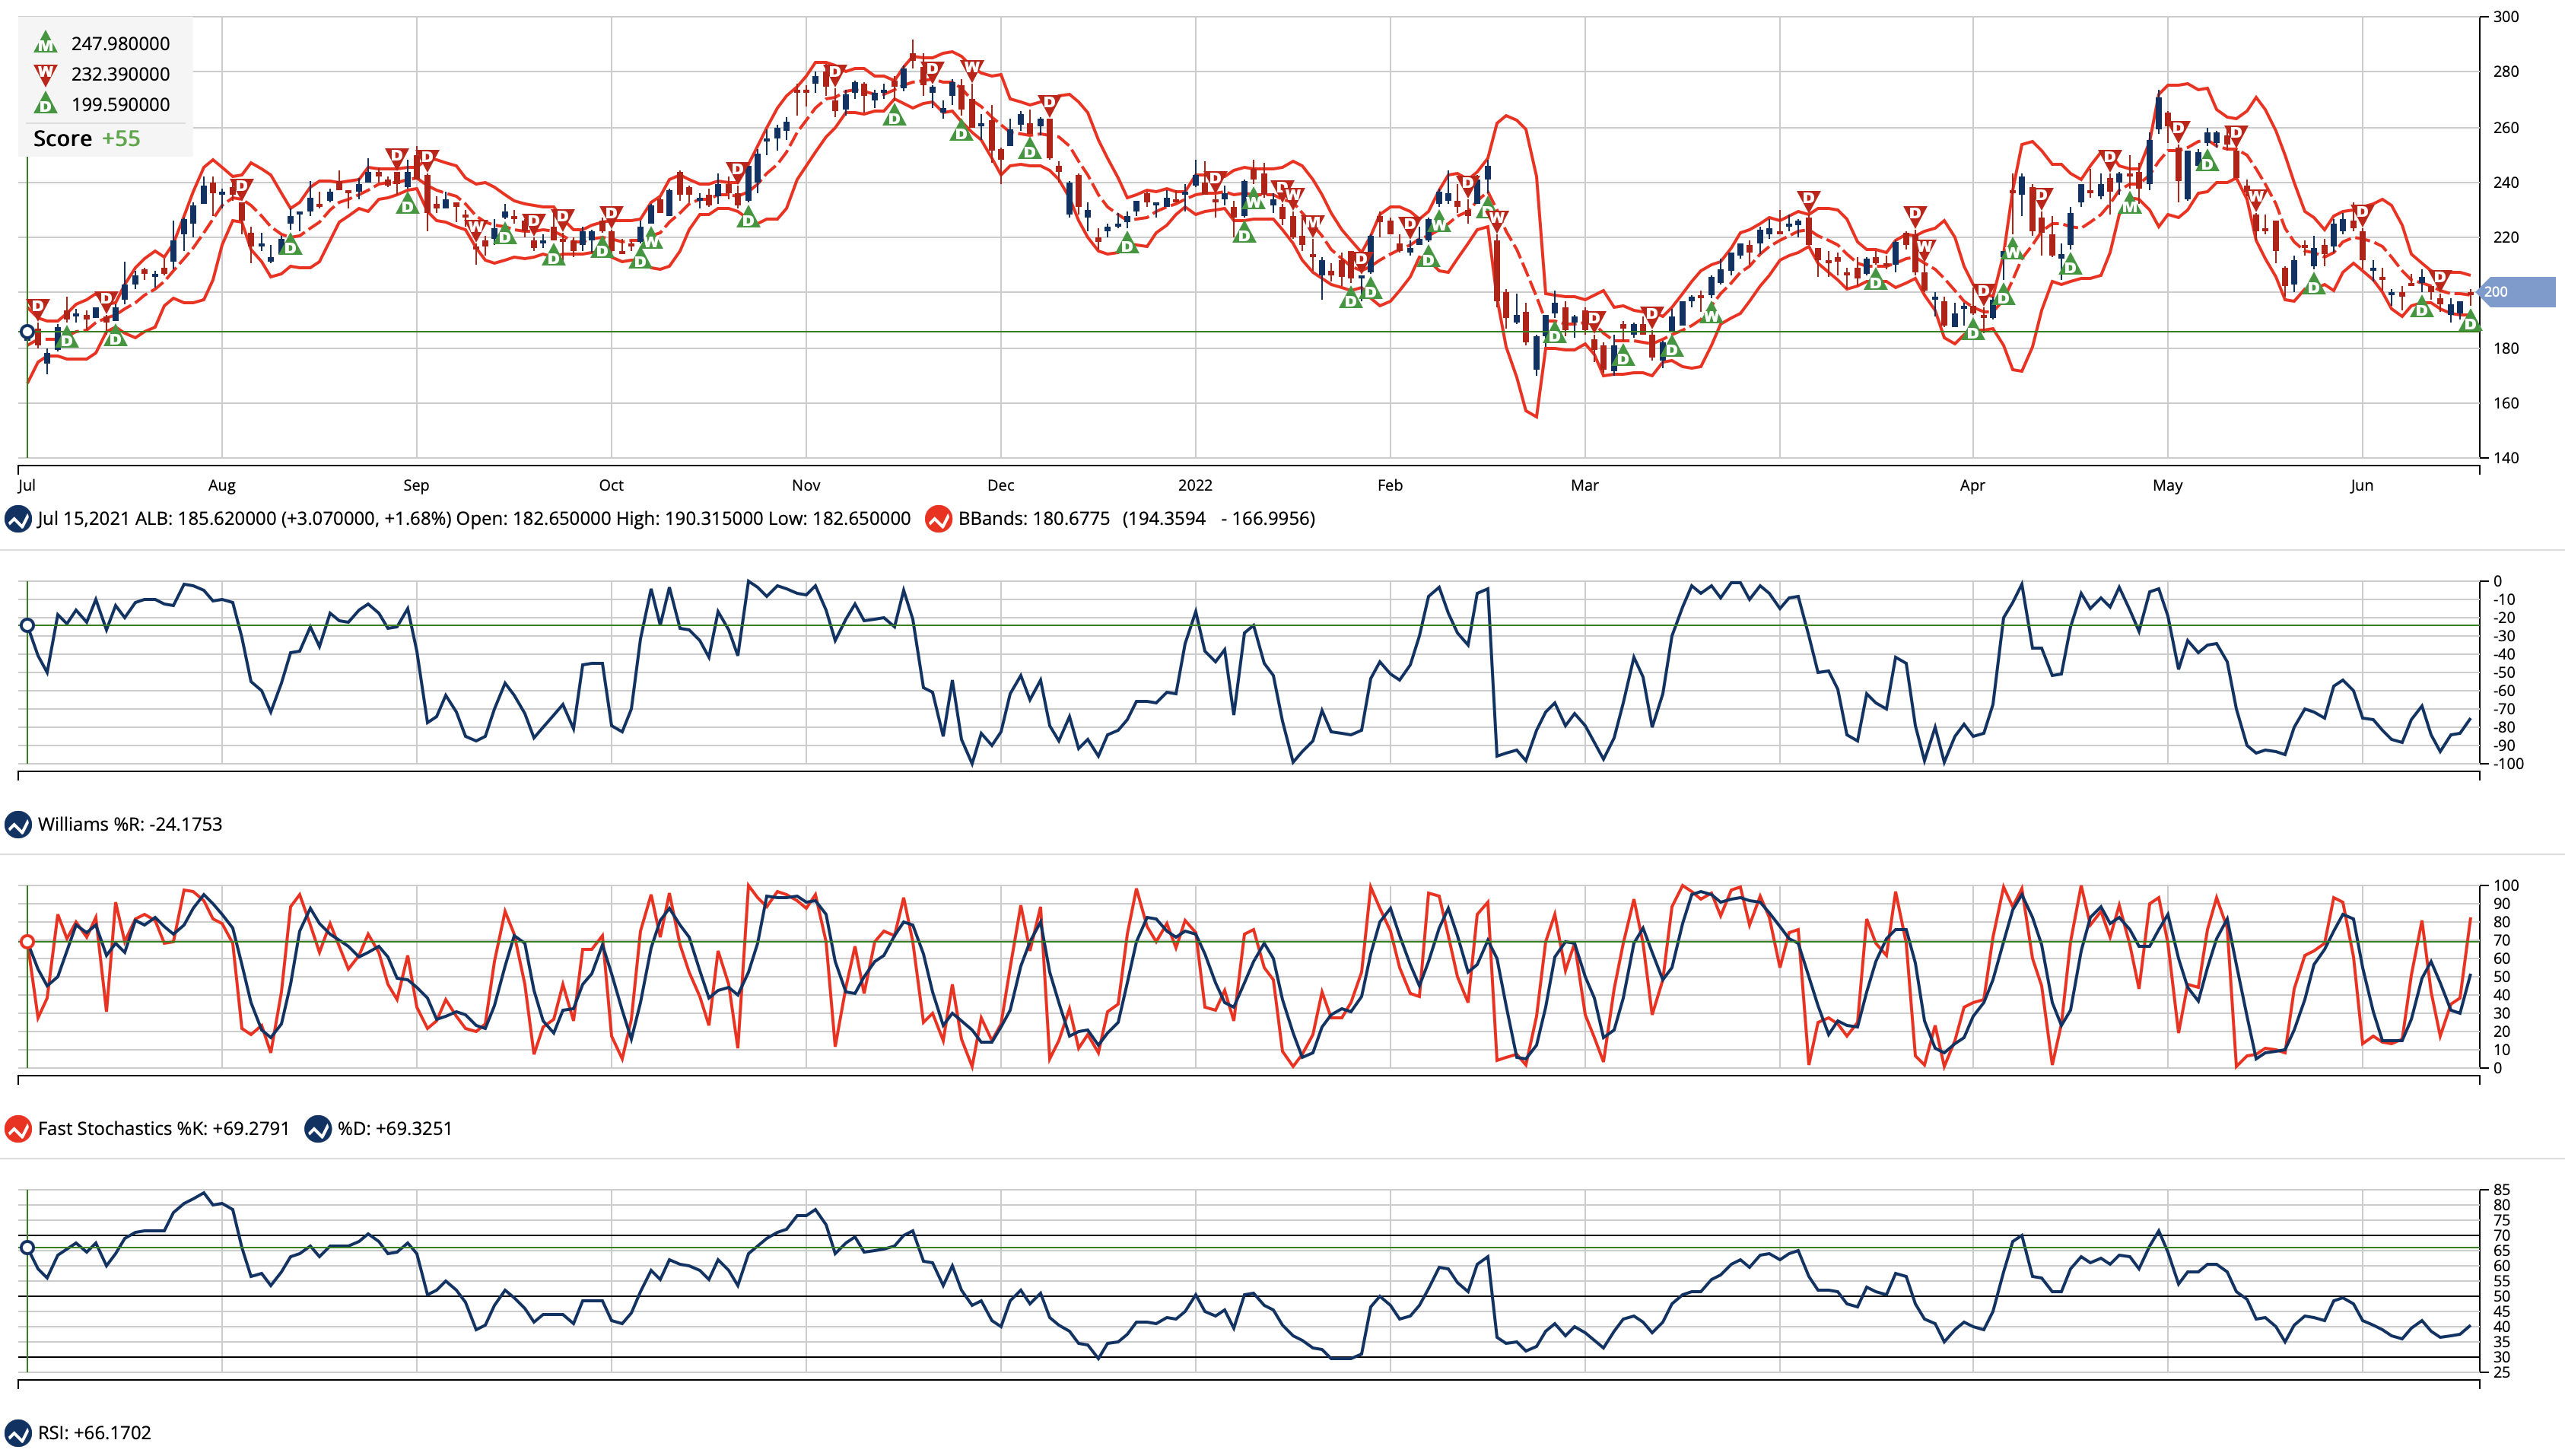
ALB stock is also technically oversold. In fact, if we pull up a one-year chart, we can see the stock just caught double bottom support dating back to April. We can also see the stock is oversold at its lower Bollinger Band, with over-extensions on Williams’ %R, Fast Stochastics, and RSI.

ALB Chart with Trade Triangles

Source: MarketClub

From a current price of $198.65, I’d like to see Albemarle Corp. (ALB) refill its bearish gap around $230 a share initially. Longer-term, I’d like to see it closer to $250.

Ian Cooper
INO.com Contributor

Disclosure: This contributor did not hold a position in any investment mentioned above at the time this blog post was published. This article is the opinion of the contributor themselves. The above is a matter of opinion provided for general information purposes only and is not intended as investment advice. This contributor is not receiving compensation (other than from INO.com) for their opinion.
S&P 500 Bullish Divergence

Last September, I called the S&P 500 index to lose 30% according to the projection based on a comparative analysis.

The index price was at $4,459 that time. The deepest valley since then was established at $3,637 last month. 18% of the index value evaporated since the idea had been posted and 25% from the top of this January ($4,819).

The majority of you voted for 10%-20% retracement and this was the closest call so far as we cannot be sure whether it is over or not.

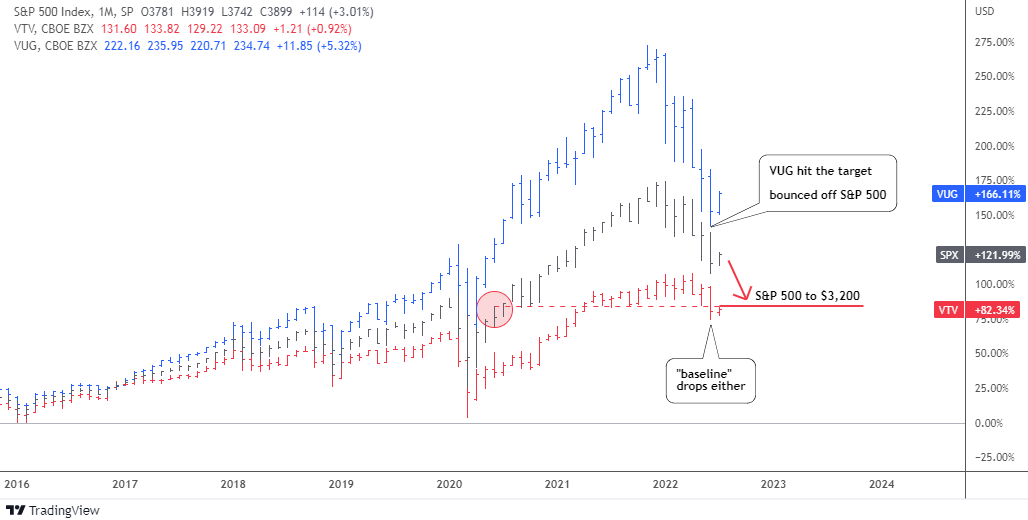
To remind you, I had put together two ETFs and the S&P 500 index (black). I chose Vanguard Value Index Fund ETF (VTV) (red) and Vanguard Growth Index Fund ETF (VUG) (blue). Let us check the updated comparison chart below.

SP500 VTV VUG Comparison Chart

Source: TradingView

The bearish alert appeared to me when the value stocks (VTV, red) stopped contributing to the rise of the broad index. Moreover, the gap between the latter and the growth stocks (VUG, blue) has widened tremendously.

The retracement targets for VUG and the S&P 500 were based on the corresponding level of underlying / less performing instrument: for VUG it was the S&P 500 and for the S&P 500 – VTV.

It is amazing how accurately the VUG target at $217 was hit last month as the ETF dropped even lower in the valley of $213. The concept played out precisely as the VUG bounced off the broad index, blue bars approached but did not overlap black bars.

The S&P 500 index almost closed the gap with the VTV last month, however the VTV itself also dropped and hence wasn’t caught up. The retracement target has been set at $3,200 last September and the lowest level has been seen since then was $3,637 last month.

Let us look at the S&P 500 chart below to see what could happen next.

SP500 Weekly Chart

Source: TradingView

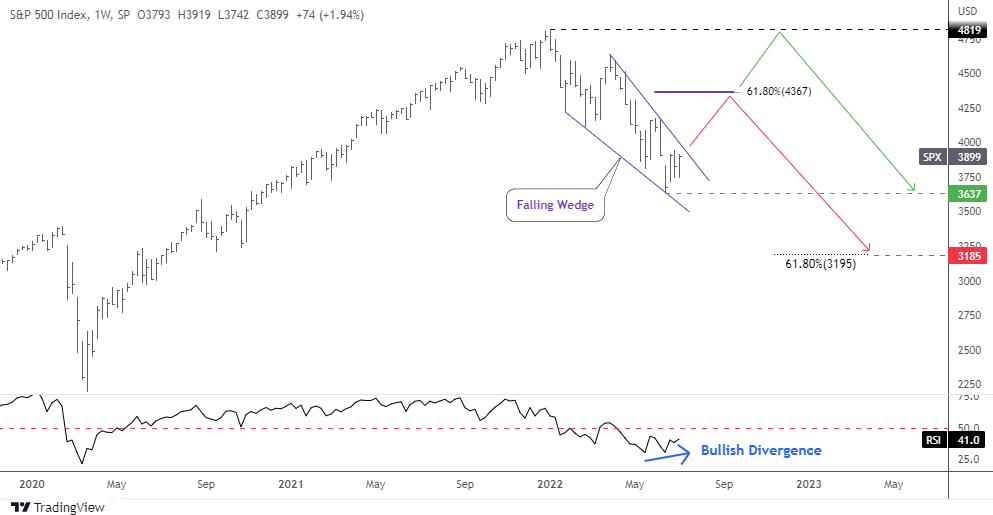
The price has shaped a familiar model of the Falling Wedge (purple) within the current retracement. The amplitude of fluctuations decreases as the price approached the apex of the pattern.

The RSI indicator has already built the invisible Bullish Divergence as it can be seen only through its readings: 30.2 vs. 30.5, which means higher valley versus the lower bottom in the price chart.

This combination of narrowing trendlines and bullish diverging indicator could result in the possible breakup anytime soon. Would it be a reversal or a dead cat bounce?

I added two paths on the chart. The red zigzag shows how the Falling Wedge would play out in the first place. The target (purple flat line) is located at the widest part of the pattern added to the breakup point. It coincides with the 61.8% Fibonacci retracement level at $4,367. It could be a double resistance.

The following drop should complete the complex correction down to $3,185. This target was calculated by subtracting the size of the Falling Wedge from the target of that pattern. And again, this area corresponds amazingly with the 61.8% Fibonacci retracement level and the first chart target based on a comparison with VTV.

The green path implies the sideways consolidation that should keep within the existing range of $3,637-$4,819.

Which way do you think the S&P 500 will go?

View Results

Loading ... Loading ...

Intelligent trades!

Aibek Burabayev
INO.com Contributor

Disclosure: This contributor has no positions in any stocks mentioned in this article. This article is the opinion of the contributor themselves. The above is a matter of opinion provided for general information purposes only and is not intended as investment advice. This contributor is not receiving compensation (other than from INO.com) for their opinion.