Three Gold Miners on Sale

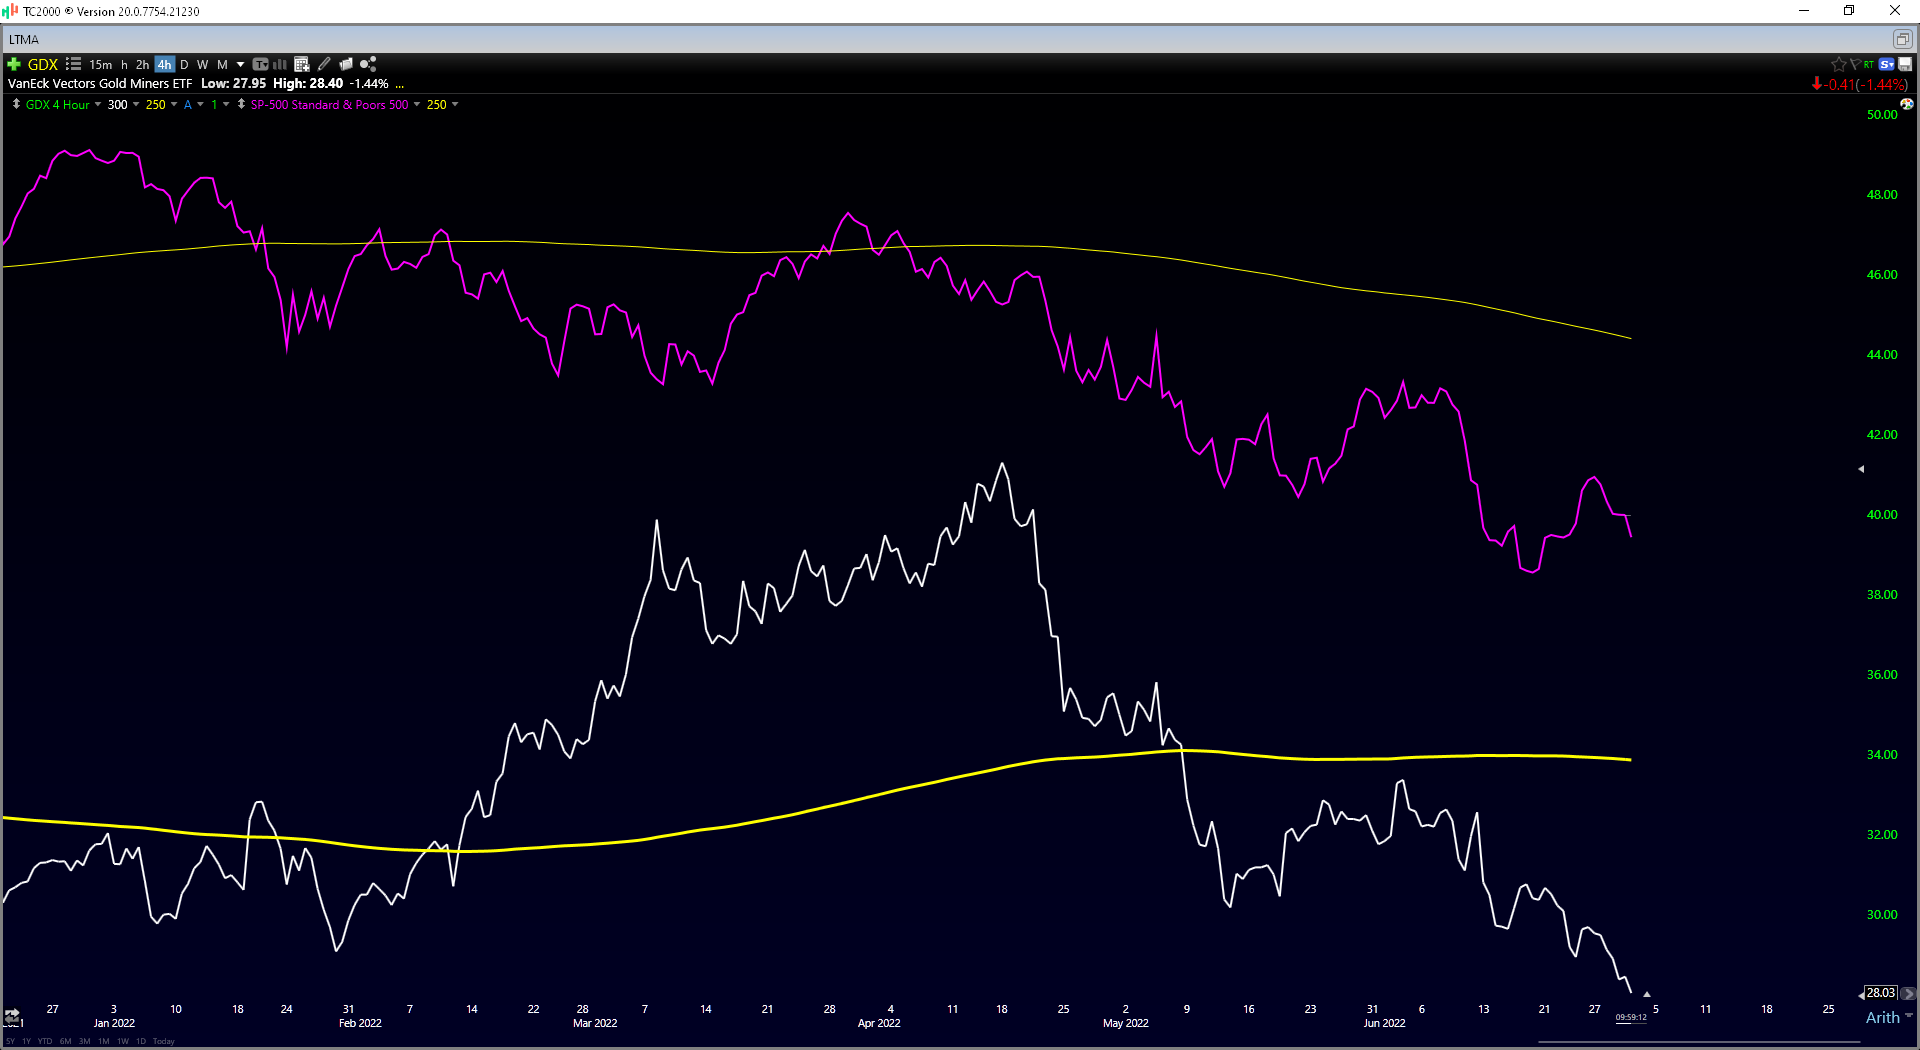
Disgust. Despair. Robbed. These are just a few of the emotions likely felt by investors in the Gold Miners Index (GDX), which are looking at the ETF trade at the same level it did over two years ago when the gold price (GLD) sat below $1,525/oz.

Worse, this pathetic performance has occurred in a period when the Federal Reserve has been its most dovish in years ahead of the past two meetings.

Now, staring down the possibility of two additional rate hikes, it's understandable that investors are on pins and needles, worried about the effect of additional rate hikes on gold and the miners. As the saying goes, though, it's always darkest before the dawn, and with sentiment arguably the worst in years, I believe this has presented some opportunities in the gold miners.

GDX Chart

Source: TC2000.com

With the Federal Reserve's mission being to stamp out multi-decade inflation readings, they've adopted one of their most hawkish stances in years, planning to raise rates four times this year.

Conventional wisdom would suggest that does not make owning gold very attractive with an alternative (higher interest rates) suddenly available.

However, the more important metric to watch is real rates, defined as the three-month treasury bill minus the current inflation rate. When real rates are in negative territory, gold tends to perform its best, given that there is a cost to not owning gold.
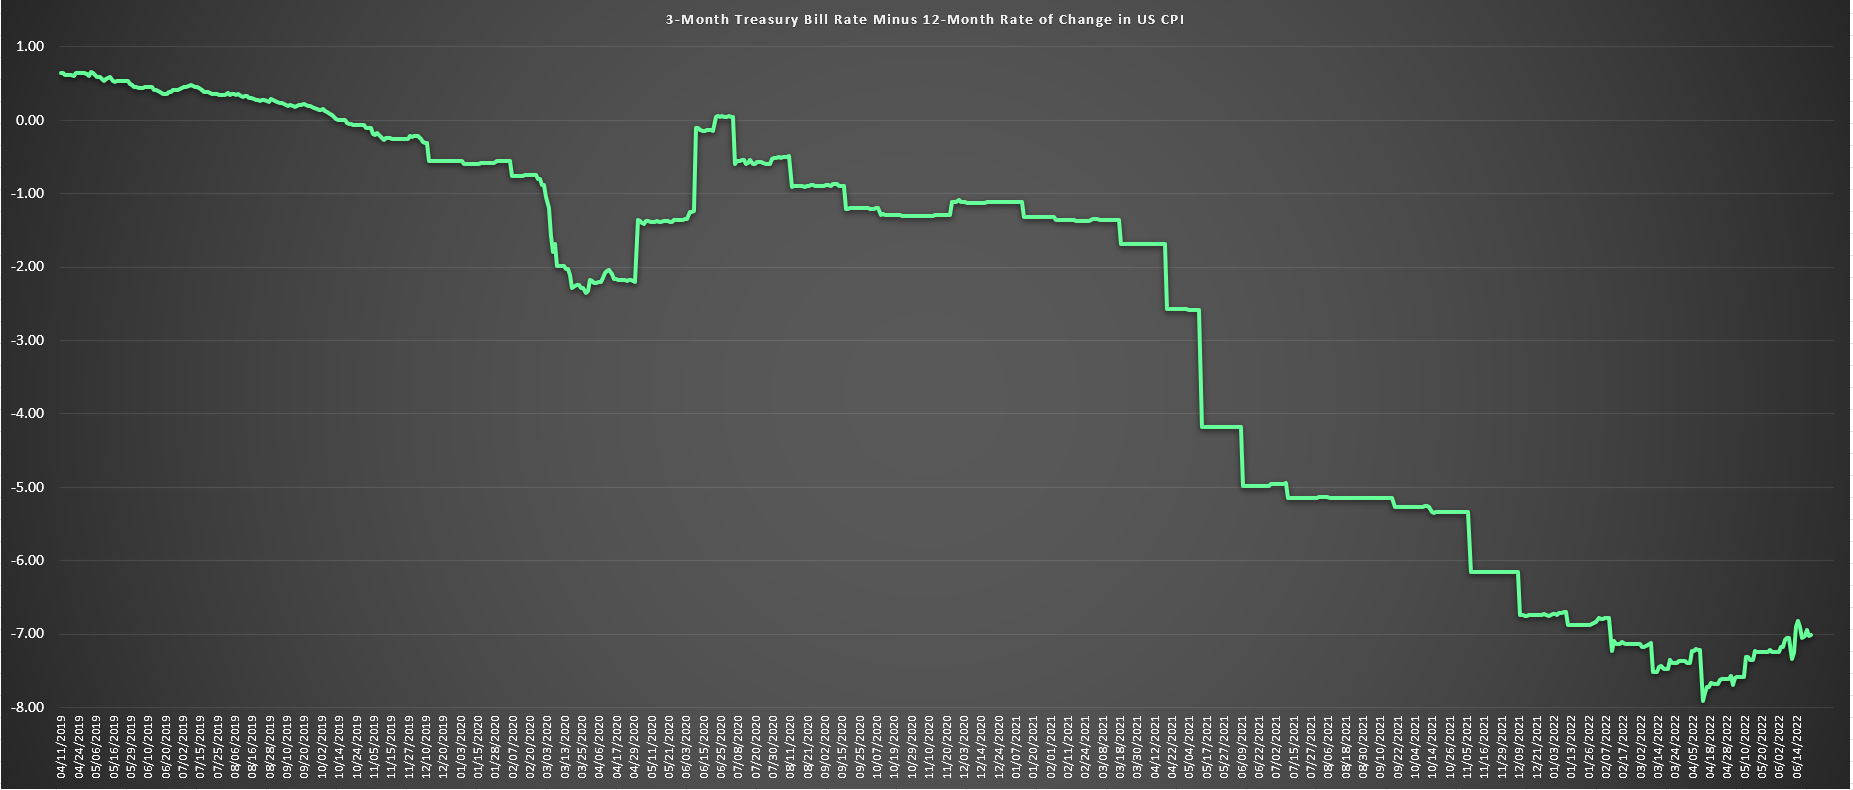
Real Rates

Source: Real Rates, YCharts.com, Author's Chart

Despite the recent rate hikes, this key indicator continues to sit deep in negative territory, hovering near (-) 7.00%. This means that even if investors are getting a better interest rate, it's being eaten away by inflation, it's which is likely to remain above 5.0%.

So, why gold miners? Gold producers mine and process gold for those unfamiliar, and they provide significant leverage to the gold price. Historically, owning them over the metal hasn't made much sense, given that they didn't pay dividends and had much higher beta to the gold price, and lacked growth.

However, for once in a decade, many of the best producers have low debt, are paying 3.5% plus dividend yields, and have growth. This makes them far more attractive than the gold price, getting leverage on the metal while being paid to wait.

Let's look at three names that stand out from a quality standpoint.

Agnico Eagle (AEM)

Agnico Eagle (AEM) is the third-largest gold producer globally, on track to produce 3.3 million ounces of gold in 2022 at all-in sustaining costs [AISC] below $1,030/oz. This makes it one of the highest-margin producers and the lowest-risk, given that it operates in the safest jurisdictions globally with 11+ mines.

Notably, AEM recently added two ultra-high-grade mines to its portfolio and the largest gold mine in Canada: Detour Lake. The company did this by merging with one of the best growth stories in the sector, Kirkland Lake Gold.

In most circumstances, I would avoid a large producer like Agnico Eagle, but the company has one key differentiator from its peers after its recent merger, which is growth.

To date, the company has not given any firm targets or long-term production guidance, but given the company's solid pipeline, which leverages existing infrastructure, I see a path to annual production of 4.3 million ounces of gold by 2029. This would represent 30% growth from current levels, 2500 basis points higher than its peer group of multi-million-ounce producers.

While most gold producers will rely on the gold price to increase earnings and free cash flow looking out over the next six years, AEM will not. Despite this growth, the company trades at its largest discount to net asset value in years, with
what I believe to be a fair value of $78.00 per share.

So, with the stock hovering below the $48.00 level, AEM is my favorite way to get gold exposure currently, especially with a 3.4% dividend yield.

Royal Gold (RGLD)

Another name that recently moved onto the sale rack is Royal Gold (RGLD), the third-largest precious metals gold/streaming and royalty company.

Unlike Agnico Eagle, Royal Gold makes an upfront payment to gold developers and producers, and in exchange, it receives a portion of the production over the project's life. This protects the company from inflationary pressures, which is essential at a time of rising costs like we're seeing currently.

Royal Gold reported attributable production volume of 88,500 gold-equivalent ounces [GEOs] in Q1 and is on track for up to 340,000 GEOs this year.

However, with a solid organic growth pipeline, there is a meaningful upside to this outlook over the next few years, with the potential for 410,000+ GEOs per annum, which is a change from the past few years when the company was in its investment phase and lacked growth.

Despite this attractive growth outlook and 80% plus margins, Royal Gold currently trades at just 25x FY2023 earnings estimates vs. its historical earnings multiple of 50x earnings (20-year average). Even using a more conservative multiple of 38x earnings, which is easily justifiable for a company with 80% margins and recurring revenue, I see a fair value of $162.20. So, with the stock currently sitting below $108.00, this looks like an attractive buying opportunity.

Karora Resources (KRRGF)

Karora Resources (KRRGF) is the riskiest name on the list, sporting a market cap of barely $400 million and being a sub-150,000-ounce gold producer in Australia. However, it also has the most upside by a wide margin and looks very attractive for a small bet.

The reason is that it boasts one of the most impressive organic growth profiles, on track to increase production from 120,000 ounces in 2022 to 220,000 ounces by 2026. The company expects to achieve this by adding a second decline at its Beta Hunt Mine and using additional processing capacity from a recent mill purchase north of the mine.

Like AEM, this will allow Karora to grow earnings and free cash flow meaningfully regardless of the gold price, with any gold price upside being a bonus. So, with the stock trading at less than 1.3x FY2025 revenue estimates, this pullback below US$2.60 looks like a gift.

Final Thoughts

The gold producers are a high-risk area of the market, but once every couple of years, there's a fat pitch, and they get sold down to levels where they trade at massive discounts to fair value.

After the most recent decline in the GDX, we have reached this period, and I see the potential for a 25% plus upside over the next 9 months in the sector while collecting a 3.0%+ dividend yield in names like AEM. Hence, I see AEM, RGLD, and KRRGF as attractive ways to diversify one's portfolio.

Disclosure: I am long AEM

Taylor Dart
INO.com Contributor

Disclaimer: This article is the opinion of the contributor themselves. Taylor Dart is not a Registered Investment Advisor or Financial Planner. This writing is for informational purposes only. It does not constitute an offer to sell, a solicitation to buy, or a recommendation regarding any securities transaction. The information contained in this writing should not be construed as financial or investment advice on any subject matter. Taylor Dart expressly disclaims all liability in respect to actions taken based on any or all of the information in this writing. Given the volatility in the precious metals sector, position sizing is critical, so when buying small-cap precious metals stocks, position sizes should be limited to 5% or less of one's portfolio.

Consumers Are in a State of Shock

As the Fed continues to posture future rate increases to battle inflation, recent economic data shows consumers are in a state of shock as price factors continue to skyrocket. Food, gas, materials, etc have shot up in price over the past 24 months – with no end in sight.

Consumers Are Recoiling Away From Traditional Spending Habits

The natural reactions of consumers fall into two categories: Grow or Survive. This is similar to how plants and trees operate. In healthy environments, plants and trees enter a growth phase – flowering and prospering. In an unhealthy environment, plants and trees enter a survival phase – directing resources toward anything essential for survival.

Global inflation is putting pressure on central banks to thwart excesses in the markets after 8+ years of easy money policies and nearly 2+ years of COVID stimulus. Consumers thus seemed to have switched into Survival mode very quickly over the last 6+ months. This reaction could have very telling outcomes for global GDP and regional economies over the next 24+ months.

In August 2021, we published an article highlighting the shift in consumer activity. It brings attention to how important Consumers are to the overall health of the global economy.

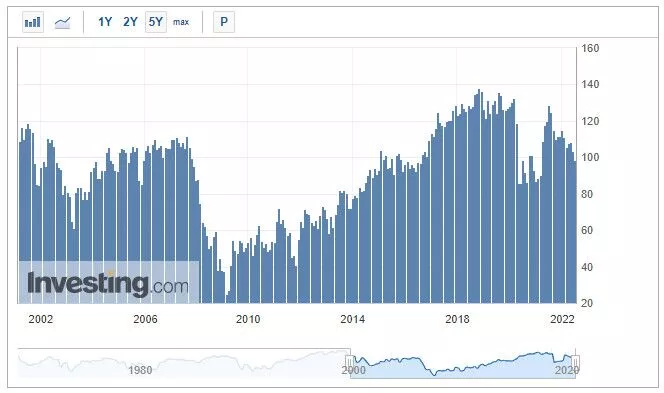
Consumer Confidence Dips Below 100

After the 2008-09 GFC, Consumer Confidence took more than 5 years to rally back above the 100 level (in 2015). The 2015-16 range was a US Presidential election year cycle – which usually disrupts US economic activities a bit.

In early 2017, Consumer Confidence started to rally higher – eventually reaching a peak in October 2018 near 137.90. Historically, the only other time Consumer Confidence reached higher levels was in 1998-99 (DOT COM Peak).

U.S. CB Consumer Confidence

Source

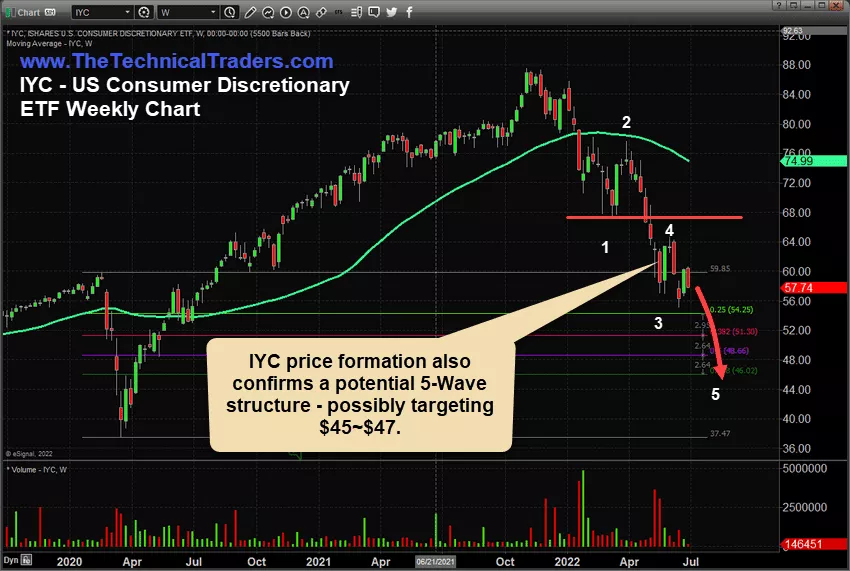
IYC May Start A Wave-5 Downtrend – Targeting $45-47 As A Base

Traders should consider the broader scope of the market trends while attempting to understand the opportunities that will come by waiting out the risks of trying to buy into a falling market. The Fed has clearly stated they intend to continue raising rates to break the inflationary cycle. Consumers will reflect these new risks by moving further away from traditional spending habits (Survival Mode) while attempting to wait out the risks to the environment.

It appears IYC has formed a moderate Wave-4 peak, which is below the Wave-1 bottom. From a technical perspective, it appears IYC will attempt to move below the $47 level over the next few weeks – attempting to establish a new base/bottom.

IYC Weekly Chart

US Real Estate Showing Signs Of A Top

No matter how you slice the data, more homes are flooding the US markets right now. Sellers are trying to “cash-out” at sky-high prices. Yet, buyers are staying very cautious because of rising interest rates and borrowing costs. Price Reductions on listed homes have risen to the highest levels over the past 8+ years. Sellers with homes on the market longer are aiming to tempt buyers with a discount. The race to the bottom has started. The Fed is going to add more fuel to the declines with another rate increase.

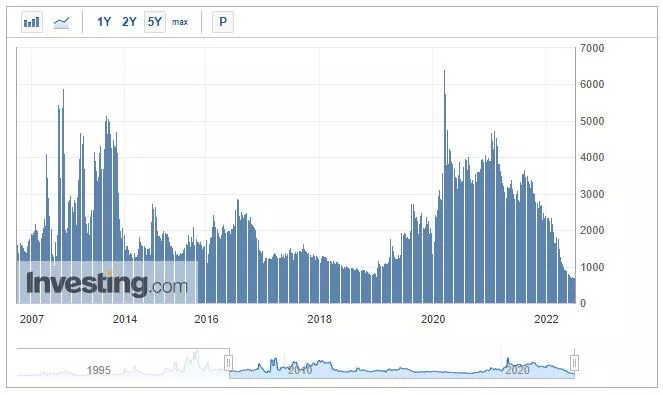
Recent Mortgage Refinance Index data shows the current 726.1 print is the lowest level since July 2000. This means the purchase and refinance are the most unfavorable for buyers over the past 22+ years (not since the peak of the DOT COM bubble).

Mortgage Refinance Index

Source

A reversion of home prices is almost a certainty at this point. I suspect a surge of new foreclosures and slowing sales will compound with layoffs and other economic contraction trends to present a “perfect storm” type of reversion event.

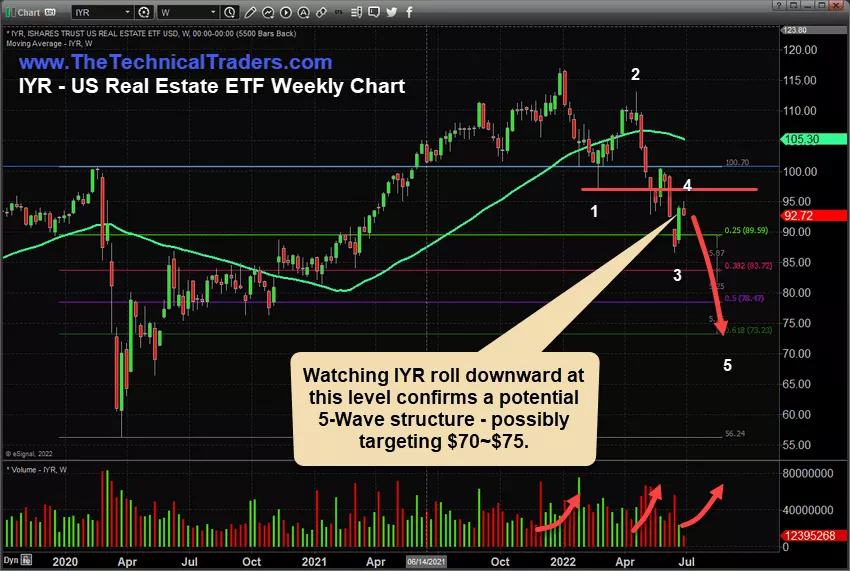
IYR Targeting $70 to $75 As Assets Unwind

IYR is likely to continue trending lower, targeting $70 to $75, before finding any real support. The reversion of asset valuation levels is still very early in the process of the Fed attempting to battle inflation. Depending on how the global markets react to the overall economic environmental change, we could see an extended contraction in assets lasting well into 2023 – possibly into 2024.

Traders should stay cautious of trying to chase the falling market trends. Real opportunity for profits exits when the reversion event is complete and when opportunities for less volatile extended trends resume.

IYR Weekly Chart

Protective Patience May Be The Best Trader/Investor Attitude Right Now

The US markets are already down by more than -25% overall. Any extended decline from current levels could push many traders/investors into a crisis. When the bottom sets up and is confirmed, we’ll begin to allocate capital back into sector trends. In the meantime, we avoid this massive drawdown event by waiting on the sidelines and being ready to deploy capital.

My strategies pulled capital out of the markets very early in 2022. Since then we have been sitting in CASH as a protective market stance while the global markets continued to decline. Protecting capital is the first rule for any trader/investor. Learning when to trade and when to be patient should be rule #2.

As Consumer Confidence continues to decline, Consumers have moved into a protective/patient (Survival) mode. Traders and Investors should consider the longer-term risks of not adopting a similar stance right now.

Learn more by visiting The Technical Traders!

Chris Vermeulen
Technical Traders Ltd.

Disclosure: This article is the opinion of the contributor themselves. The above is a matter of opinion provided for general information purposes only and is not intended as investment advice. This contributor is not receiving compensation for their opinion.

Here's What's Next for BTC and Stocks

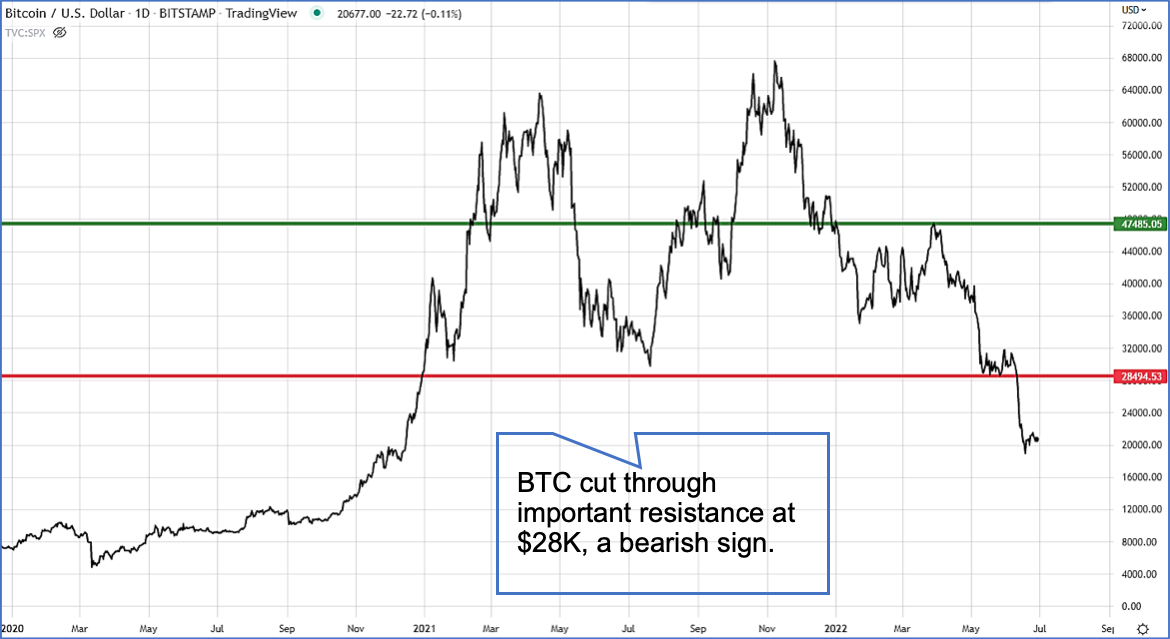
There’s no doubt about it: Bitcoin (BTC) has broken down. In fact, it recently sliced through significant support at the $28K level like a hot knife through butter. Take a look...

BTC Daily Chart

Source

As you can see from this daily chart of BTC, the dominant crypto dropped below resistance that had been firmly established back in 2021. I recently wrote about this level being a crucial line in the sand for BTC. And unfortunately, it failed to hold up.

So, where do go from here? If you look at the left side of the above chart, it’s clear that the best case for BTC support now sits somewhere in the range of $6K to $12K. And from its current level, it’s pretty much a straight shot to that range.

In addition, BTC spent quite a bit of time meandering in that range during 2020. I wouldn’t be surprised that, if we get that low, you’ll see similar sideways action.

And it’s not just BTC that’s gotten hammered. In fact, the entire cryptocurrency space now stands at somewhere around $1 trillion in market cap. That’s a far cry from the $3 trillion it enjoyed late last year.

Ouch.

But before you sound the death knell of crypto, remember that it’s not the only asset that’s been taken out back recently. In fact, I could just as easily put a chart up there of the Dow, the S&P, the Nasdaq, and the Russel 2000 and you would be reading much the same story, albeit not as dramatically.

Fear is Driving Selling

As I’ve been saying for months, investors are looking at crypto just like they do every other risky asset... they are selling. And they’re selling pretty much regardless of what’s happening to the asset’s underlying fundamentals.

Why all the selling? Pretty simple: The markets are oozing with fear right now. And when fear takes over, lots of assets get thrown out, no matter how good their underlying fundamentals may actually be.

That’s sad, but it’s true.

So, what’s driving all the fear? Take your pick. Inflation, global supply chain issues, the war in Ukraine, geopolitical uncertainty, higher interest rates.

And the rub of it is that all of these are playing a significant role in amping up the fear in the marketplace. If it was just one, it wouldn’t be so bad. But it’s not - it’s all of them.

The war in Ukraine is contributing to inflation of energy and food prices. Supply chain issues are contributing to higher prices and operational uncertainty. Meanwhile, inflation is making everything more expensive.

But it’s the last fear driver that I mentioned - higher interest rates - that really has everyone on edge. And while we all agree that those higher interest rates are the medicine to fight inflation, no one knows for sure how high they must go to get results. So far, inflation continues to roar higher despite higher interest rates.

Maybe we can take some solace in the fact that the Fed will likely continue to raise rates until the inflation numbers are headed in the right direction. Chairman Powell’s said as much to Congress just last week. And I don’t have much doubt about his - or the Fed’s - resolve to bring inflation down.

But until we begin to see inflation numbers drop, it’s a done deal that you’ll see more of the fear-based volatility and chop that you’ve seen for stock, tech, and crypto since the beginning of the year.

Sure, you’ll likely see some up weeks in the meantime. And there’s little doubt that an outlier or two in these asset classes are likely to thrive. But overall, until inflation gets under control, the outlook for crypto, stocks, and tech is lousy.

We Shouldn’t Be Surprised

The fact is we shouldn’t be surprised by what’s happening in all these risky asset classes. There’s had been gobs of money sloshing around the economy for years. And that low-priced capital has made just about everyone go out and buy a ton of stuff.

In my book, that’s been a good thing. It’s helped people and business weather a massive pandemic, driven innovation, and provided much-needed jobs for millions.

But one of the side effects of that cheap money has been inflation levels, unlike anything we’ve seen in decades. Certainly, because of all that cheap money, I figured we might see an uptick in inflation. But I had no idea it would come at us in such magnitude. Nobody did.

And when it comes to crypto, we shouldn’t be surprised that it’s been beaten up even more than its peers. While risk has had a hand in that, the fact that crypto is still a nascent and largely unproved asset class and marketplace make it worse. It’s simply going to get beat up worse when investors lose their appetite for risk.

So, what to do? As I mentioned, I think we’re going to see a moderation in inflation down the road. And when that happens the markets - including crypto - will start to recover. When that happens - and let’s say we get a handful of decent inflation reports - I would begin heeding my golden rule: Buy companies that know what they’re doing in markets with strong upside. And don’t sweat the small stuff. Take a long-term view. And don’t devote any more than 1% to 2% of your portfolio to all your crypto holdings, including BTC.

Stay safe,
Wayne Burritt
INO.com Contributor

Disclosure: This contributor may own cryptocurrencies, stocks, or other assets mentioned in this article. This article is the opinion of the contributor themselves. The above is a matter of opinion provided for general information purposes only and is not intended as investment advice. This contributor is not receiving compensation (other than from INO.com) for their opinion.

Rising Rates: Financials Will Greatly Benefit

The Federal Reserve raised interest rates by 75-basis points at its most recent meeting and forecasted that a similar rate hike could on the table in July. These efforts are necessary to stamp out the persistently high inflation throughout the economy.

The most recent 75-basis point rate hike was the largest since the 1994 rate tightening cycle.

The financial cohort will benefit via a confluence of a rising interest rates, financially strong balance sheets and the easy passage of annual stress tests to support expanded buybacks and increased dividends.

Bank of America (BAC), JPMorgan Chase (JPM), Morgan Stanley (MS), Citigroup (C) and Goldman Sachs (GS) look appealing at these levels, off substantially from their 52-week highs.

Net Interest Income

Net interest income is an important financial measure that is essentially the difference between interest paid and interest received thus the revenue generated by its loans and interest paid out on its deposit base.

Bank stocks perform well in a rising interest rate environment as the interest income earned from loans rises faster than what they pay for funding. The higher interest rates go, the greater the net interest income banks earn.

Immaterial Geopolitical Exposure

The big banking cohort has minimal to no direct exposure to Russia/Ukraine thus not tied directly to the geopolitical conflict. This is especially important as the geopolitical tensions rage on and possibly snap up these stocks as a function of overall market sentiment.

Overall, the big banks generate an inconsequential amount of revenue from Russia. For example, BAC, JPM and MS do not have direct exposure to Russia in their regulatory filings.

However, GS is estimated to have $940 million total exposure to Russia and Ukraine, or less than 0.1% of its total assets, per Bank of America. Citigroup (C) had $9.8 billion exposure to Russia, including $5.4 billion in Russia-specific exposure, equating to only 0.3% of the bank’s total assets.

As such, there is not a single company within the collective big bank cohort has any more than 0.3% of its total assets exposed to the Russian/Ukraine conflict.

2022 Financial Stress Tests

The financial cohort easily cleared the Federal Reserve's annual stress test, removing any concern that there’s systemic financial risk in the economy, circa 2008.

The results of the Fed's annual stress test exercise showed the banks have enough capital to weather a severe economic downturn and paves the way for them to expand share buybacks and increase dividend payouts.

The 34 lenders with more than $100 billion in assets that the Fed oversees would suffer a combined $612 billion in losses under a hypothetical severe downturn, the central bank said. But that would still leave them with roughly twice the amount of capital required under its rules.

The Fed assesses how banks' balance sheets would fare against a hypothetical severe economic downturn. The results dictate how much capital banks need to be healthy and how much they can return to shareholders via share buybacks and dividends. This stress test gives investors comfort that the big banks are well-prepared for a potential U.S. recession.

The 2022 stress tests are especially important as the world faces a geopolitical crisis that may reverberate through the global economy. All this considered, it’s refreshing to know that these stress tests were easily passed and indicate that the biggest U.S. banks could easily withstand a severe recession.

Conclusion

The geopolitical backdrop, rising inflation, China Covid lockdowns and rising interest rates will continue to weigh on investor sentiment.

The financial cohort is much more resilient and capitalized and have demonstrated their ability to evolve in the face of the pandemic and will weather these economic challenges as well. The 2022 stress tests were easily passed and indicate that the biggest U.S. banks could easily withstand a severe recession or geopolitical crisis.

This cohort presents compelling value, especially with substantially reduced valuations in a rising interest rate environment into 2023, which may serve as a long-term tailwind for banks to appreciate higher.

Just recently, MS and BAC boosted dividend by 11% and 5%, respectively. MS also authorized a new $20 billion share repurchase program. The positive results of these annual stress tests will likely allow expanded capital returns over the years to come in a fiscally responsible and accountable manner.

Noah Kiedrowski
INO.com Contributor

Disclosure: Stock Options Dad LLC is a Registered Investment Adviser (RIA) firm specializing in options-based services and education. There are no business relationships with any companies mentioned in this article. This article reflects the opinions of the RIA. Any recommendation contained in this article is subject to change at any time. No recommendation is intended to constitute an entire portfolio. The author encourages all investors to conduct their own research and due diligence prior to investing or taking any actions in options trading. Please feel free to comment and provide feedback; the author values all responses. The author is the founder and Managing Member of Stock Options Dad LLC – A Registered Investment Adviser (RIA) firm www.stockoptionsdad.com defining risk, leveraging a minimal amount of capital and maximizing return on investment. For more engaging, short-duration options-based content, visit Stock Options Dad LLC’s YouTube channel. Please direct all inquires to

in**@st*************.com


. The author holds shares of AAPL, ADBE, AMD, AMZN, ARKK, AXP, BA, BBY, C, CMG, COST, CRM, DIA, DIS, EW, FB, FDX, FXI, GOOGL, GS, HD, HON, INTC, IWM, JPM, MRK, MS, MSFT, NKE, NVDA, PYPL, QQQ, SPY, SQ, TMO, UNH, USO, V and WMT.

Backdoor Marijuana Investment Play

Scotts Miracle-Gro (SMG), a company that is best known for Scotts branded products like fertilizers and grass seeds, is also a backdoor marijuana investment play.

Most marijuana investors know this, but they may not fully understand how Scotts is involved in the marijuana industry and why that could make Scotts slightly more of a risky investment than some people believe it to be.

Scotts Miracle-Gro is a very well-known business and it has a good reputation. However, its core business is not one that is typically booming.

Over the past ten years, prior to 2020, Scotts average sales grew just 2%. This shouldn’t bee much of a surprise considering the business the company is in. Furthermore, the average 2% sales growth could in many years be contributed to nothing more than price increases.

Then came 2020, when people where stuck at home, looking at their poorly maintained lawns and starting gardens. Due to increased demand, likely because of pandemic-related changes to people’s lives, Scotts' annual sales increased by 24%.

Company management and analysts all believe that most of the people who took up gardening or did decide to improve their yard, will continue to stick with Scotts and their new hobby.

With that said, analysts are only expecting Scotts' sales growth to be in the 2-4% annual growth range during the coming years. Not the kind of growth you may expect from a high-flying marijuana stock.

Scotts has exposure to the marijuana industry through its fertilizers and the basic equipment needed to set up a marijuana farm.

Back in 2014, Scotts formed the Hawthorne Gardening Company, which sells products used by cannabis growers. Then in 2015, Hawthorne bought General Hydroponics, a 35-year-old liquid nutrient producer, of which its products are considered the gold standard by many marijuana farmers.

While the Hawthorne Gardening Company does sell fertilizer, due to its acquisition of General Hydroponics, the growth in the division comes from new marijuana growing facilities being opened.

So as the pace of legalization of marijuana in US States and major countries around the world slowly diminished, the need for new hydroponic growing equipment that Hawthorne sells also began to drop.

More recently the marijuana industry has been in an ‘oversupply’ situation. This not only nearly stopped all sales from Hawthorne, but it also hurt Scotts' sales figures. With annual sales growth dropping from 24% to a more expected 2-4%, Scotts' stock price has taken a massive hit, falling from a 52-week high of $193.50 down to currently trading in the low $80 range.

Some investors argue that now is the time to buy SMG because of the low valuation, decent dividend and potential for the marijuana industry to make another move forward.

For that to happen, we will need to see one of two things to occur:
1. A massive increase in marijuana usage in the states that it is legal, or
2. New states in the US or countries around the world open their doors to the marijuana industry.

Either of these situations would increase demand for marijuana, thus new grow houses would need to be built and supplied so they can begin growing marijuana. Without either happening, Scotts' Hawthorne business will continue to produce just mediocre numbers.

Some investors believe that SMG is undervalued, and that very well may be true. If the marijuana industry continues to grow in the future and we see more and more US States and countries around the world legalize the substance, then Scotts' Hawthorne division will perform better, helping push the SMG stock price higher again.

But there are two problems investors face while they wait for legalization to occur.

First is that SMG's management has reportedly been considering spinning off the Hawthorne business, and thus their whole marijuana industry connection. This would be force SMG investors to consider whether or not they owned SMG for the marijuana play. Analysts believe that the growth will largely come from the Hawthorne side of the business, and thus spinning it off would allow investors to reap the greatest benefits since it will no longer be ‘held back’ by the Scotts side of the business.

The second issue investors will be facing is simply time. The amount of time that they will have to wait for the new laws to be passed. Investors need to consider the opportunity cost of waiting a long time. In the past, in the US, the legalization cycle has taken a few years. We have a few new states all at once and then nothing for a few years. So, it may be a few more years before we see another big demand surge for Hawthorne’s products.

Some analysts will agree that SMG is a good buy with or without Hawthorne and that it is even worth holding, as long as Hawthorne is still a subsidiary, while you wait for new states to legalize marijuana. But that is a decision each investors needs to consider individually especially since SMG has shown us a very good example of a boom-and-bust business just over the past few years. This has been evident in the SMG stock price peaking at $244 per share back in March of 2021 and the stock now trading at just over $80.

Matt Thalman
INO.com Contributor
Follow me on Twitter @mthalman5513

Disclosure: This contributor did not hold a position in any investment mentioned above at the time this blog post was published. This article is the opinion of the contributor themselves. The above is a matter of opinion provided for general information purposes only and is not intended as investment advice. This contributor is not receiving compensation (other than from INO.com) for their opinion.