Taming Inflation - Tough Action Needed

Curbing Inflation - The Priority

Rolling back inflation is an absolute necessity before these markets can start to turn back this tide of relentless selling. The process of curbing inflation will not be quick, nor will it be an easy feat. A delicate balance must be exercised to curb inflation via rising rates while not destroying the economy.

To curtail these 40-year highs in inflation, the economy will need to slow, demand will need to cool and the supply chain will need time to catch up to come back into balance.

The Federal Reserve will raise short-term interest rates from historic lows near zero as the economy recovered from the pandemic. The Federal Reserve will be looking for lower CPI numbers, softer labor market conditions and resolution of supply chain constraints prior to taking a dovish stance on future rate hikes. The latter will be the confluence of catalysts the market needs to propel higher.

Overall Markets

The overall markets have been under heavy and relentless selling. The average Nasdaq stock has undergone a 50% drop from its high.

The S&P 500 now trades at a level first reached more than 16 months ago in early February 2021. This move negates the post-Covid advance in equities.

The multi-wave corrections that culminated in February 2016 and December 2018 both bottomed at levels first reached nearly two years prior. Thus, these markets are reaching the point where the past two years of appreciation has been erased.

Bank of America’s Bull & Bear Indicator, which captures fund flows and other market-based risk-appetite measures, is well in the fearful depths that typically imply a buying opportunity. During prolonged stressed periods (i.e., 2000-’02 and 2008-’09) bear markets had this gauge persistently stuck at these low levels while prices continued to trend lower.

University of Michigan consumer sentiment poll came in at a level lower than during the global financial crisis and if not revised higher will rank as the bleakest monthly reading since 1978. Extreme negative readings in the University of Michigan poll have served as great inflection points for how stocks perform over the subsequent 12-month period.

Per JPMorgan the S&P 500 has averaged a 25% gain in the year following the eight Michigan sentiment troughs going back 50 years, with the worst return at 14%.

It’s noteworthy to point out that hindsight is 20/20 thus troughs are only known in a look-back analysis after sentiment starts to recover from a low. The markets may be close but may not be at this point yet.

Key Macroeconomic Factors

The Consumer Price Index (CPI) has become the most influential and critical variable in today’s market. The CPI readings directly impact monetary policy put forth by Federal Reserve via interest rate hikes, bond buying and liquidity measures.

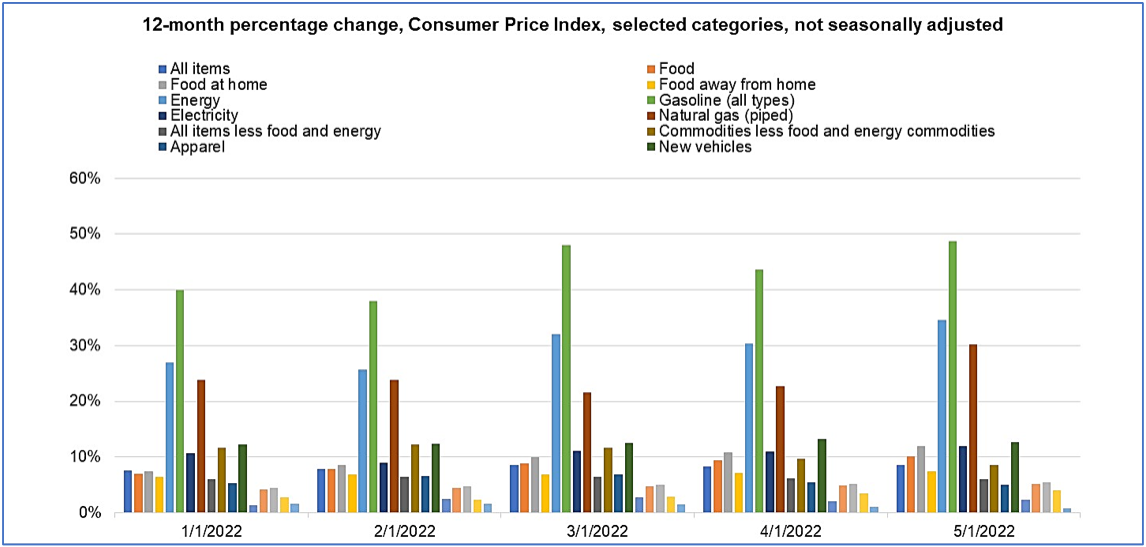
Inflation continues to be persistent throughout the economy and the Federal Reserve must balance curtailing inflation without destroying the economy. The impact of inflation is now flowing through to companies and consumers alike. Inflation has reared its ugly head and is now negatively impacting companies’ gross margins and dampening consumer demand due to soaring prices, specifically gasoline.

The confluence of rising interest rates, inflation, China Covid lockdowns and the war in Ukraine has resulted in first half of 2022 overwhelmingly negative. As such, the market appears to be factoring in a worst-case scenario that may result in a Federal Reserve induced recession as a function of over-tightening on monetary policy and/or its inability to combat inflation responsibly to engineer an economic “soft landing”.

However, if any of these macroeconomic factors abate (i.e., CPI, China re-opening, Russian/Ukraine conflict and interest rate hikes) this could serve as a launching pad for the markets to stabilize and appreciate higher.

Inflation - 40 Year Highs

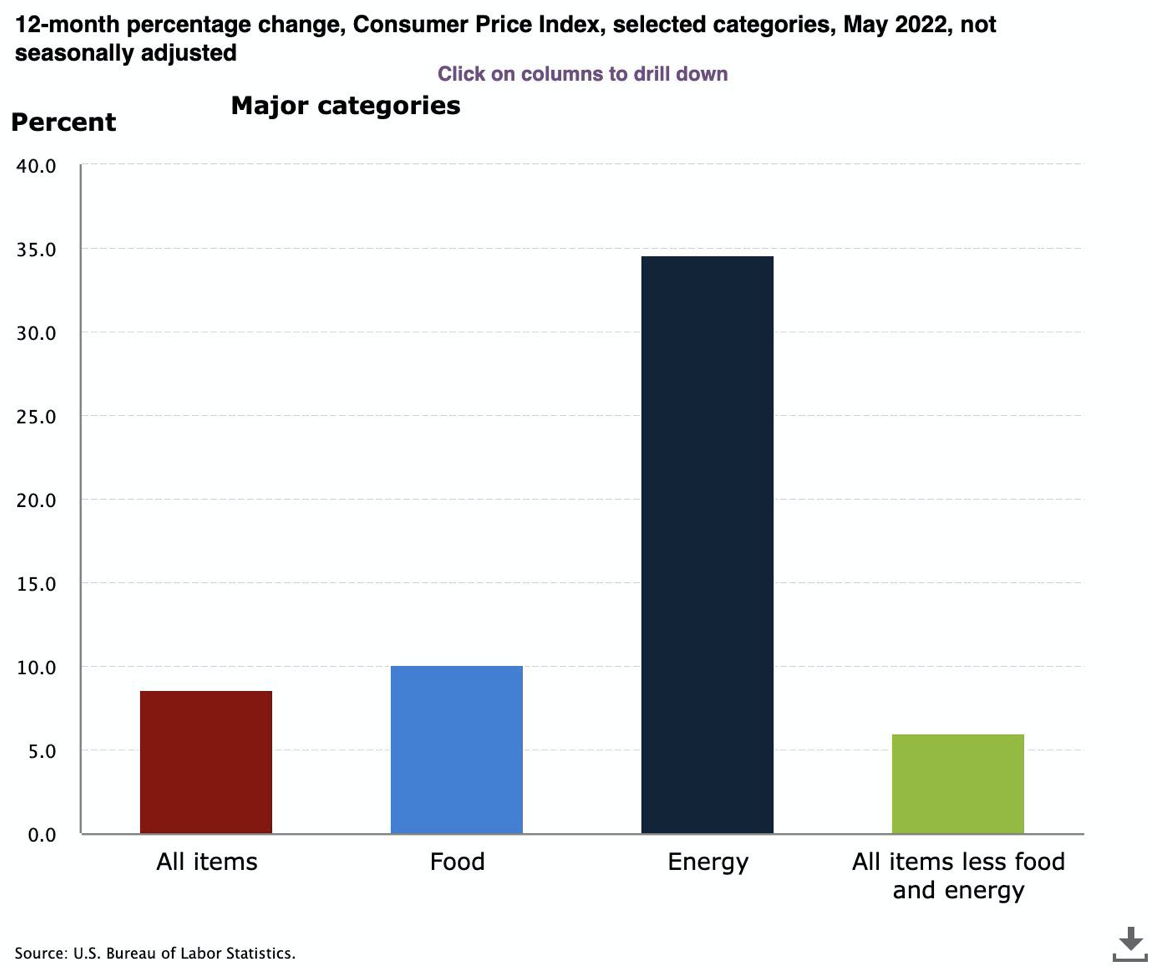
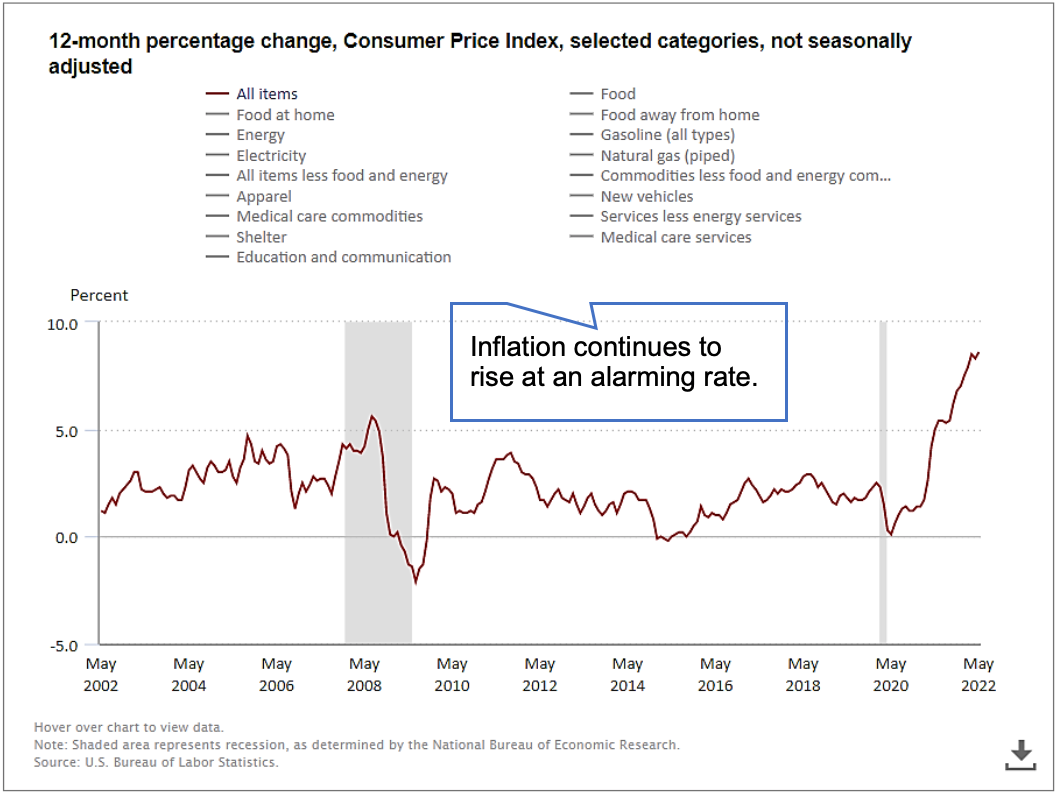
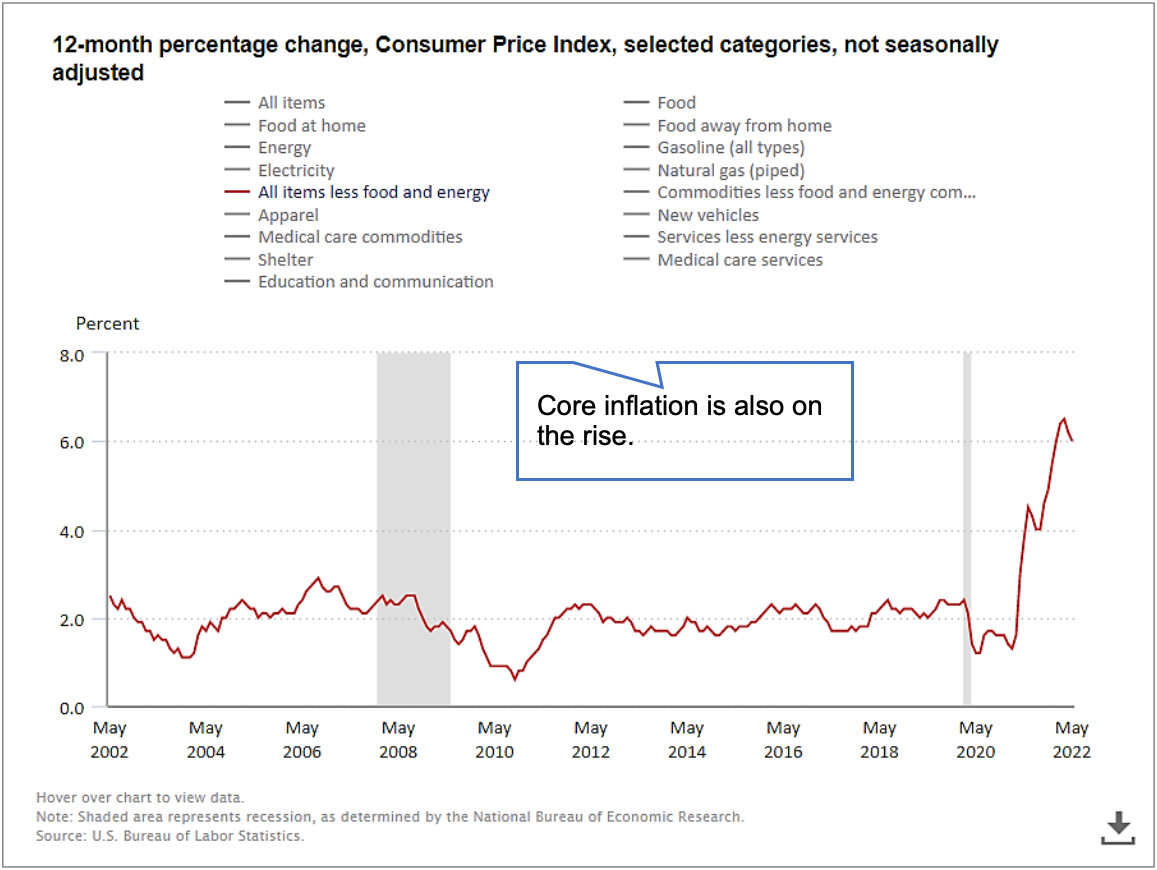
Inflation pushed higher in May as prices rose 8.6% from a year ago for the fastest increase in nearly 40 years. Excluding volatile food and energy prices, core CPI was up 6%. Both CPI and core CPI exceeded estimates and came in hotter than expected. Surging costs for shelter, gasoline and food prices all contributed to the increase.

The latest CPI numbers casted doubt that inflation may have peaked and adds to fears that the U.S. economy is nearing a recession.

The CPI report comes at a time when the Federal Reserve is in the early stages of a rate-hiking campaign to slow growth and bring down prices. May’s report likely locks-in multiple 50 basis point interest rate increases ahead. With 75 basis points of rate rises already put in place, markets widely expect the Fed to continue tightening through 2022 and likely into 2023.

Conclusion

Curbing inflation is an absolute necessity for the markets to stabilize and start to reverse the tide of relentless selling. A delicate balance must be exercised to curtail these 40-year highs in inflation.

As a consequence, the economy will need to slow, demand will need to cool and the supply chain will need time to catch up to come back into balance.

The Federal Reserve will be looking for lower CPI numbers, softer labor market conditions and resolution of supply chain constraints prior to taking a dovish stance on future rate hikes. The latter will be the confluence of catalysts the market needs to propel higher.

The Consumer Price Index (CPI) has become the most influential and critical variable in today’s market. The impact of inflation is now flowing through to companies and consumers alike with Target and Walmart issuing profit warnings.

The market appears to be factoring in a worst-case scenario that may result in a Federal Reserve induced recession as a function of over-tightening on monetary policy and/or its inability to combat inflation responsibly to engineer an economic “soft landing”. It will likely take successive downward CPI readings before rates will stabilize and the markets can appreciate higher.

However, if any of the other macroeconomic factors abate (i.e., China re-opening and Russian/Ukraine conflict) this could serve to accelerate the stabilization of the markets and remove the functional constraints for the markets to appreciate higher.

Noah Kiedrowski
INO.com Contributor

Disclosure: Stock Options Dad LLC is a Registered Investment Adviser (RIA) firm specializing in options-based services and education. There are no business relationships with any companies mentioned in this article. This article reflects the opinions of the RIA. Any recommendation contained in this article is subject to change at any time. No recommendation is intended to constitute an entire portfolio. The author encourages all investors to conduct their own research and due diligence prior to investing or taking any actions in options trading. Please feel free to comment and provide feedback; the author values all responses. The author is the founder and Managing Member of Stock Options Dad LLC – A Registered Investment Adviser (RIA) firm www.stockoptionsdad.com defining risk, leveraging a minimal amount of capital and maximizing return on investment. For more engaging, short-duration options-based content, visit Stock Options Dad LLC’s YouTube channel. Please direct all inquires to

in**@st*************.com


. The author holds shares of AAPL, ACN, ADBE, AMD, AMZN, ARKK, AXP, BA, BBY, C, CMG, CRM, DIA, DIS, FB, FDX, FXI, GOOGL, GS, HD, HON, IBB, INTC, IWM, JPM, MA, MS, MSFT, NKE, NVDA, PYPL, QCOM, QQQ, SBUX, SPY, SQ, TMO, and V.

Wishful Thinking

Relax, folks. There isn't going to be a long recession, if there is one at all, and you're probably not going to lose your job, and inflation will be down below 3% by next year. The Fed’s got your back.

That's the story from the Federal Reserve’s incredibly optimistic projections released after the end of Wednesday's interest rate-setting meeting. I use the word “incredibly” deliberately, because these projections seem anything but credible. But we can hope.

Somewhat lost in the release of the Fed's 75 basis-point hike in the federal funds rate last Wednesday is that U.S. GDP growth will remain fairly positive this year, next year, and into 2024, according to the Fed’s latest projections.

The Fed now forecasts U.S. GDP will grow by 1.7% this year as well as in 2023, rising to 1.9% in 2024. Now those are down from the Fed’s March projections, to be sure, but they still remain above recessionary (i.e., negative) levels.

Likewise, the Fed is projecting that the unemployment rate will end this year at 3.7% and 3.9% next year, before rising to 4.1% in 2024. Again, those are worse than the March projections but not overly so, considering all the scare talk about how the Fed’s newly hawkish rate-rising policy will inevitably cause a recession and a jump in unemployment.

Meanwhile the Fed is also projecting that the PCE inflation rate will end 2022 at 5.2% before dropping in half to 2.6% next year and to 2.3% in 2024, again higher than its March projections but dramatically lower than where we are today at more than 8%.

How does the Fed plan to manage all this, you ask? It sees the fed funds rate reaching 3.4% by the end of this year and 3.8% in 2022, again above its March projections but a lot lower than what you would have expected, given that the yield on the two-year Treasury note is already well above 3%.

In other words, the Fed is merely playing catch-up to where the market has already been for a while.

All in all, I would say, a pretty positive story, a lot better than what we had been expecting. But how much of it can be believed? What the Fed is telling us is that it believes it can really engineer a soft landing, meaning only a moderate rise in the unemployment rate and no recession, at the cost of just slightly higher interest rates, at least compared to today’s inflation rate and current bond market rates.

In other words, the Fed says it can tame inflation back down to less than 3% all while leaving interest rates five percentage points below the current 8% inflation rate. Is that possible?

Meanwhile, what is President Biden doing for his part in trying to drive down inflation? Other than not interfering with Fed policy, which he claims is basically all he can do, he is blaming oil executives for the high price of gasoline.

Short of charging them with getting in bed with Vladimir Putin, he's laying the blame for high energy prices on their failure to explore and drill for oil, leaving out his administration's role in basically forbidding them to do just that and putting pressure, through the Fed and other means, not to lend them money in order for them to do so.

You would think Biden would have been happy that they are not drilling for oil, contributing as they are to the blissful carbon-free future he imagines. But he seems to believe he can have it both ways, namely no new oil production and low gas prices. But I guess that’s the same type of logic the Fed is using in trying to convince us it can whip inflation with a few interest rate hikes with little harm to the overall economy.

The market reaction to all this was fairly predictable. Right after the Fed rate announcement was greeted with euphoria on Wednesday, people woke up the next morning and said, “Hey, wait a minute. This can't possibly be true,” and the selling resumed with renewed fervor.

And why not? Can we take any comfort in what the Fed and our government are telling us, which is that after a dozen years of easy money, quantitative easing, artificially low interest rates, and massive fiscal and monetary stimulus, they can undo all that in a year or so without anyone being inconvenienced?

If only it worked that easily. If Powell wanted to be honest, he could have said, “Folks, there will be a lot of pain over the next couple of years to undo all we have done over the past decade, so brace yourselves for it.”

But people don’t want to hear that, especially in an election year. Although the market seems to know better.

Visit back to read my next article!

George Yacik
INO.com Contributor

Disclosure: This article is the opinion of the contributor themselves. The above is a matter of opinion provided for general information purposes only and is not intended as investment advice. This contributor is not receiving compensation (other than from INO.com) for their opinion.

Oil For The Fire

One of the largest factors affecting economic models everywhere has been the volatility of oil prices - just this week, the US Bureau of Labor and Statistics published the monthly inflation number and it wasn’t pretty... The CPI was up 1% in May!

Consumer Price Index - 12 month percentage change

The culprit? A 49% increase in fuel prices; economists were shocked as regular gasoline or airfare costs skyrocketed quicker then they ever have with this being the driving factor.

However, it is in these unaccounted for swings where an investor can truly profit and in analyzing the underlying moves in this economic driver we can see that oil is in one of it’s strongest uptrends of this decade.

Crude Oil Chart

Taking a closer look at oil’s technicals, it is evident that crude’s rally has high volume to support continued buying at higher and higher levels through this decade-leading uptrend.

In fact, the MarketClub tools are still showing a clear buying opportunity on both the weekly and monthly charts even as the commodity trades far above its moving averages.

Only recently have energy prices been caught up in the broader risk-off sentiment of the market this week, creating what I think will be an isolated buying opportunity as RSI on the day chart is clocking in at 50, a level unseen since the beginning of this most recent uptrend just over a month ago.

What’s Catalyzing Higher Prices?

Given the above technicals positioning the commodity-correlated energy sector for an entrance opportunity, diving deeper into the market’s catalysts substantiate that further given a couple of key factors:

The rise of resource nationalism has only become more and more prevalent since the onset of the Ukraine-Russia conflict.

An increasing amount of countries have become more cognizant of the need to protect their natural resources and put themselves first by choking the international market of their supplies... this has created a supply-push inflationary environment that shows no signs of stopping as Libya became the most recent country to stop exporting oil just this week!

Crude Oil Chart

Everyone’s favorite cartel won’t be able to make up for this shortage.

At OPEC's last ministerial meeting just over a week ago, the group decided to increase oil output by an extra 648,000 b/d over both July and August...

This only makes up for half of what the market has lost from Russia alone and the problems with OPEC’s production don’t end there; in fact, it’s around this time of the year that many member countries service their production facilities, putting even more of a strain on output (stay on top of OPEC news and read their meeting notes here)

Investing In This Arena – BP & USOI

Starting with one of the world’s 7 ‘supermajor’ oil producers, British Petroleum Plc (NYSE:BP) is a solid foundational energy pick for your portfolio that stands out from the rest - it hasn't rallied to the degree of its peers and is still discounted by the market! That is despite BP’s promising growth catalysts and its 10 quarter run of positive earnings surprises.

BP has only been sold cheaply as a result of the high CAPEX on their ESG/green initiatives (more than any other firm in the space), this will pay multiples in the future so why not get paid a stunning 3.93% dividend yield to wait for them to become the industry leader of the energy sector’s future?

BP Chart

Alternatively, if you want a less systematically risky pick and you’re more of a sector investor, I believe USOI is the holding for you. This product by Credit Suisse is a unique oil fund in the sense that it is a covered call exchange traded note (ETN) that tracks and provides returns based on the performance of the price return version of the Credit Suisse Nasdaq WTI Crude Oil FLOWS™ 106 Index (QUSOI).

The best part of this ETN is its otherworldly monthly coupon yield - the yield currently sits at 21.27% on an annualized basis and the fund has already paid 86 cents-per-share to the investor YTD.

Don’t sleep on either of these picks as the energy sector has dethroned tech as Wall Street’s favorite in this new economic shift!

Visit back to read my next article!

Peter Tsimicalis
INO.com Contributor

Disclosure: This article is the opinion of the contributor themselves. The above is a matter of opinion provided for general information purposes only and is not intended as investment advice. This contributor is not receiving compensation (other than from INO.com) for their opinion.

Here's the REAL Inflation Story

I have to admit: About halfway through last month, I was sitting in my car waiting for gas at the local grocery store and I had a gut-wrenching feeling.

My prediction about inflation peaking in April at an 8.3% annual rate might be wrong.

Dead wrong.

So as I sat their waiting for my turn, staring at gas close to $5 a gallon, I had to face the facts that energy costs are simply not moderating as quickly as I had hoped. And without having to do a deep dive right there into the data, I knew that that these stubborn gas prices were enough to blow my hopes of inflation moderating in May.

Fast forward a couple of weeks to just a few days ago when the latest inflation numbers hit the street. Fact is I don’t have to tell you that my mid-May revelation about inflation turned out to be true.

Inflation is on a Tear

During May inflation rose at a mind-boggling 8.6% annual rate. That marks the fastest pace of rising prices since December 1981, over four decades ago. See for yourself:

Consumer Price Index - All Categories

Source

As you can see from this chart of annual changes in consumer prices, the story of high inflation continued unabated in May. And across the board, every category of prices showed increases: Food was up a 10% annual rate in May, energy was up 35%, and all types of gasoline rose a staggering 49%.

49% rise in gas prices! Whew!

Now, if you strip out the more volatile food and energy prices and drill down into the so-called “core” inflation rate, the story isn’t much better: Core inflation rose at a 6% annual rate in May.

Consumer Price Index - Core

Source

When core inflation rises, it’s a clear indicator that the rise in prices in broad and robust. The above chart clearly shows that that holds true in May.

But as I drilled even deeper into this data, I didn’t think that was the whole story. So, I decided to get into the nitty gritty behind these numbers and crunch some of my own analytics from the Bureau of Labor Statistics (BLS) raw data. (The Bureau of Labor Statistics is one of the two major sources of inflation data. The other is the Personal Consumption Expenditures index from the Bureau of Economic Analysis). This is what I came up with…

Consumer Price Index - 12 Month Percentage Change

Source

This chart shows the major price categories tracked by the BLS and what’s happened with their pricing activity since the beginning of the year. Think of it as the bigger brother to the prior off-the-shelf chart from BLS.

As you can see, the annual changes in every price category are at worrisome levels. And those annual increases have been in the works for months.

So, while the latest inflation numbers are troubling, fact is they are only the latest installment in a trend that’s been sticking around way too long. And that makes these inflation numbers a trend, another reason for concern.

What bar stands out for you from the above chart? Without a doubt, the dubious winner in higher prices since the beginning of the year is the green bar. And as you might guess that bar represents the annual increase in gasoline prices.

So, while the fact that gas shot up 49% in May compared to a year ago is bad enough, the above chart shows that gas has been clocking annual increases in the 40% area throughout 2022.

More Fed Handwringing Coming

No doubt about it, inflation is on a tear. And since the most recent numbers are showing that top line inflation shows little signs of slowing the Fed is likely to do a lot of handwringing.

In addition, with little doubt that analysts at the Fed, the Whitehouse, and the Bureau of Labor Statistics are doing the same analytics on the raw data that I did, they’re going to see that inflation is chronic across all pricing categories.

What does that mean? It means that the Fed is likely to be even more aggressive with raising interest rates in the future. They’re going to do pretty much anything in their power to try to extract liquidity from the market so people and businesses cool their spending and bring prices down. And if the stock market takes a hit in the process, well then so be it.

But don’t forget: While higher interest rates do work, they don’t function in isolation. The massive increase in gas prices is tied to the increase in the price of oil which is tied to the war in Ukraine, among other factors. So, until that conflict abates and oil prices begin to moderate, we’re not likely to see a ton of improvement in gas prices.

The super-tight labor market – which is a good thing for wages and workers – also tends to put pressure underneath prices. So, with not enough workers right now to fill job vacancies – and unemployment in the multi-decade low range – labor prices themselves are pushing prices higher.

What to do? For investors with holdings in just above every inflation sensitive asset – including crypto, stocks, bonds, and real estate - the best course of action is to continue to monitor what the Fed does and only add to positions that you feel are the most inflation resilient. Then just sit back and play the waiting game. And don’t forget: There’s no shame in being on the sidelines while these inflation forces continue to work themselves out of the economy.

Stay safe,
Wayne Burritt
INO.com Contributor

Disclosure: This contributor may own cryptocurrencies, stocks, or other assets mentioned in this article. This article is the opinion of the contributor themselves. The above is a matter of opinion provided for general information purposes only and is not intended as investment advice. This contributor is not receiving compensation (other than from INO.com) for their opinion.

Three Gold Miners To Buy On Dips

It’s been a turbulent month for the markets, but while the S&P-500 (SPY) and Nasdaq Composite (QQQ) are deep in negative territory, the price of gold has been holding up well. This is evidenced by its (-) 1% monthly return and flat performance year-to-date.

This 2000 basis point out-performance for the yellow metal should not be overly surprising, given that it typically performs its best when real rates are deep in negative territory.

While this is good news for gold investors, it’s also good news for gold miners, one of the few industry groups holding the line on margins. Let’s take a closer look below:

Gold to S&P500 ratio

Source: TC2000.com

Gold Miners Index

One of the preferred ways to get exposure to the gold price is through the Gold Miners Index (GDX), the most popular ETF that holds a basket of 50 miners. The problem with the index is that at least 50% of gold miners are un-investable, and several are poorly run, so the high proportion of laggards dilutes the performance of the ETF.

For this reason, my favorite way to play the sector is to focus on individual names, particularly those with high margins and growth. Three companies that meet this criterion are Agnico Eagle (AEM), Orla Mining (ORLA), and Karora Resources (KRRGF).

Agnico Eagle

Beginning with Agnico Eagle, the company is a 3.4-million-ounce producer with 11 mines that operates out of Canada, Australia, Mexico, and Finland.

While producers of this size are typically not known for growth, Agnico has an enviable pipeline of non-operating assets it’s looking to bring online (Hope Bay, Santa Gertrudis, Upper Beaver). These projects combined could add 600,000 ounces of additional gold production by 2027.

Apart from this, Agnico has organic growth at multiple assets, including a new shaft at Macassa, the potential to integrate a nearby deposit, and plans for higher throughput at Detour. Combined with its non-operating pipeline, this could push annual production to 4.4 million ounces by 2028.

Agnico Eagle Growth, Company Filings

Source: Agnico Eagle Growth, Company Filings, Author's Chart & Estimates

This 30% production growth profile places Agnico in rare air among its peers, where most million-ounce producers struggle to maintain production levels as their highest-grade reserves are depleted.

Combined with industry-leading margins and 95% of production from Tier-1 jurisdictions, Agnico should command a premium multiple, easily justifying an earnings multiple of 24 and a P/NAV multiple. This translates to a fair value of ~$75.00 per share, making the stock a steal on this pullback below $52.00.

As a bonus, investors are getting a nearly 3.0% dividend yield at current prices.

Orla Mining

The second name worth keeping a close eye on is Orla Mining, a new producer with a ~100,000-ounce production profile in Mexico.

The company is a single-asset producer, which generally makes for a riskier investment, but it recently announced that it would be acquiring Gold Standard Ventures, a gold developer in Nevada. Not only does this diversify the company from complete reliance on Mexico for its operations, but it should also transform it into a dual-asset producer by 2025, with multi-asset producers typically commanding higher multiples due to their lower risk profile.

Gold Standard’s South Railroad Project [SRP] is similar to Orla’s current producing mine, Camino Rojo, with both being heap-leach operations, which Orla has experience with, having just built this mine on time and under budget last year.

Assuming Orla chooses to develop the SRP, the company could grow production to more than 300,000 ounces per annum by 2026 at costs below $850/oz. This could easily justify a market cap of $1.65BB, which, divided by ~330MM fully diluted shares, would translate to a fair value of $5.00 per share.

Based on a current share price of $3.45, and with the stock being in the unfavorable post-acquisition period when stocks often come under pressure, I don’t see this as a buying opportunity just yet.

However, if we were to see ORLA dip below $2.95 per share, this would present a low-risk buy point for a starter position in the stock with ~70% upside to fair value.

ORLA Mining Company Presentation

Source: Company Presentation

Karora Resources

The last name worth keeping an eye on is Karora Resources, a mid-tier producer operating in Western Australia that’s also focused on growth.

As outlined last year, the company plans to increase gold production to 200,000 ounces per annum by 2025, up from ~100,000 ounces in 2021. This is expected to be accomplished by adding a second decline at its flagship Beta Hunt Mine and doubling ore production from the mine.

However, after a recent acquisition of a new mill (Lakewood) just north of Beta Hunt, it’s looking like there’s the potential to increase annual gold production to 240,000 ounces by 2026 due to extra capacity (addition of a second mill to process material).

Karora Growth Plan

Source: Karora Growth Plan, Company Presentation

Following this upgraded outlook, Karora now has one of the most impressive growth profiles sector-wide, with a ~19% compound annual growth rate from 2022-to 2026 if it can meet these production goals.

This production growth is expected to be coupled with margin expansion as it boosts nickel production (higher by-product credits) and benefits from economies of scale. So, with the stock 40% off its highs below US$3.10 per share, I see the stock as a steal at current levels.

Final Thoughts

With the gold miners out of favor and trading at their cheapest valuations relative to the gold price in more than five years, I believe now is the time to begin scaling into the sector with long positions into weakness.

In my view, Agnico Eagle and Karora Resources are two of the most attractive ways to play this trend towards gold’s recent outperformance vs. equities. Elsewhere, if Orla sees more share-price weakness below $2.95, this will represent another growth name to complement a portfolio in an industry where it’s difficult to find growth historically.

Disclosure: I am long AEM, KRRGF, GLD

Taylor Dart
INO.com Contributor

Disclaimer: This article is the opinion of the contributor themselves. Taylor Dart is not a Registered Investment Advisor or Financial Planner. This writing is for informational purposes only. It does not constitute an offer to sell, a solicitation to buy, or a recommendation regarding any securities transaction. The information contained in this writing should not be construed as financial or investment advice on any subject matter. Taylor Dart expressly disclaims all liability in respect to actions taken based on any or all of the information in this writing. Given the volatility in the precious metals sector, position sizing is critical, so when buying small-cap precious metals stocks, position sizes should be limited to 5% or less of one's portfolio.