The mighty metal has almost hit the Bull Flag’s target, which was set two months ago. Gold was got close as it reached $1439 on June 25th and only had $6 left to reach that level. Usually, when the impulse of the price gets exhausted without breaking the important level or after it briefly penetrates the latter, then the price quickly retraces in the opposite direction. And that’s what we got with the gold price as the impulse initially looked strong enough to catapult the metal to the $1500 area, but suddenly it failed. Therefore, the price dropped back below $1400 to $1382. Then the buyers actively bought this drop up again to the former top, but they stopped just $1 below it and capitulated there as the price plummeted to $1386 back below $1400. These seesaw moves make traders nervous as it is dangerously volatile with more than $50 setbacks.
The question is if it is a pitfall and we shouldn’t expect any further strength of gold, or it’s just a pit stop to make a pause to accumulate a momentum for another push higher? Let’s look into the chart below to try to figure it out.
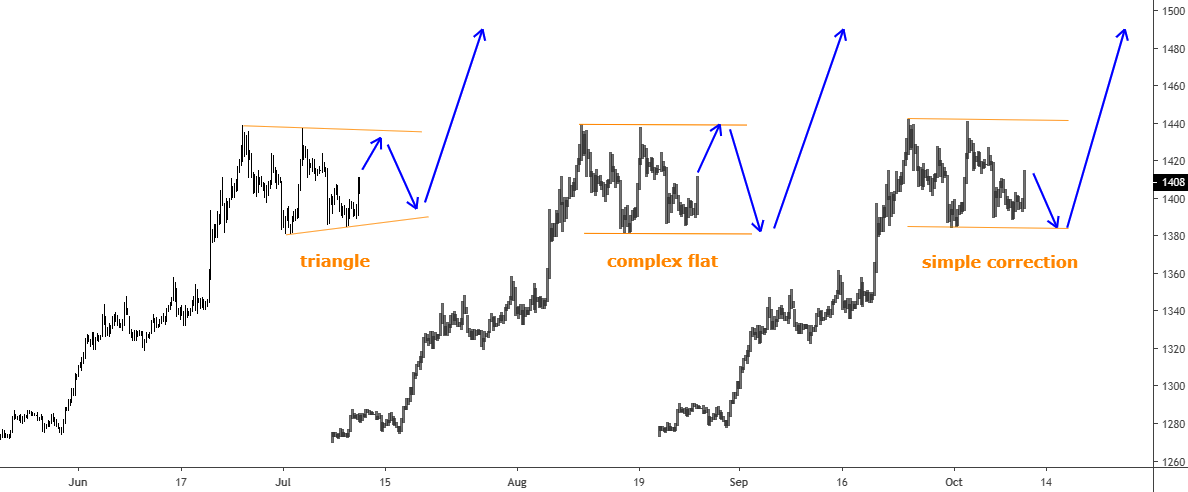
I dipped into the 4-hour time frame to show you what happens there.

Chart courtesy of tradingview.com
First of all, I would like to point out that I believe that we are just in a correction before another push higher, so I choose the pit stop option for the gold. Therefore, my chart will be based on this idea. Continue reading "Gold Update: Pitfall Or Pit Stop?"


