Pendulum Swing No.5: Back To Success!

It’s time to announce the result of the 5th Pendulum swing pushed this January. In that race, I put heating oil (ultimate futures winner in the second half of 2017) vs. wheat futures (the top loser). The Pendulum effect favored the top loser, i.e., wheat to beat heating oil in the six month period. The image below contains the poll results of your voting for that experiment.

Image 1. Poll results

CBOE Volatility Index (VIX)
Chart courtesy of INO.com

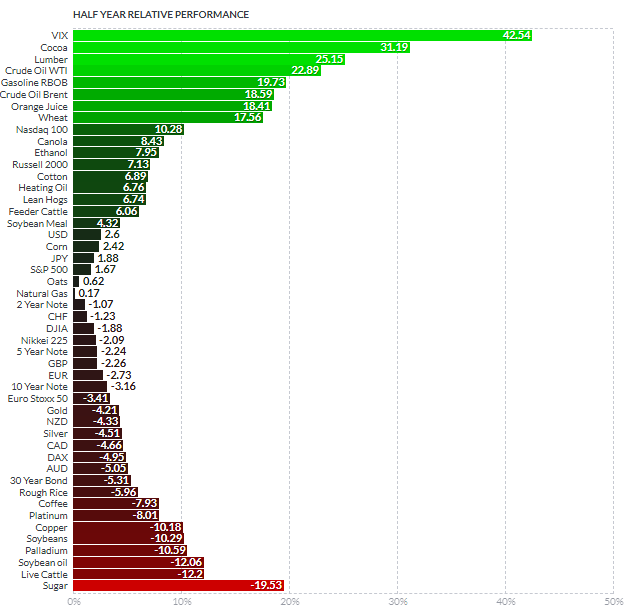
Bingo! The majority of you guessed right choosing wheat as a winner and as you can see in the next chart that wheat has gained +17.56% as heating oil gained only +6.76. I would like to express my gratitude to those who chose the experiment success option for your trust! So after the first failure in the second half of 2017 (4th swing), the Pendulum experiment is back on a winning track! Let’s try it again and see what happens.

Chart 1. Half Year Futures Performance (First Half of 2018)
CBOE Volatility Index (VIX)
Chart courtesy of finviz.com

This time we will have an interesting race as the winner in the first half of 2018 is not a commodity, but the CBOE Volatility Index (VIX) also known as the stock market fear gauge. It gained more than 40%, leaving its rivals far behind amid the roller-coaster ride in the S&P 500.

On the other side, which is red, there is the biggest loser, sugar with an almost 20% loss in the first half of 2018. The supply glut in the sugar market undermined the price for this commodity significantly. Continue reading "Pendulum Swing No.5: Back To Success!"

Does Oil Hold The Key To The Canadian Dollar

Aibek Burabayev - INO.com Contributor - Metals - Canadian Dollar


At the end of last month, I called for a substantial upcoming weakness in crude oil as the market could have finished the long-lasting consolidation after the earlier crash from 100+ levels. Indeed, oil lost almost $4 from that time and now is rebounding as markets naturally move in zigzags.

Oil-related currencies also suffer, and in this post, I would like to share with you an exciting chart setup with tremendous profit potential for one of such currency, the Canadian Dollar (CAD) also known as “Loonie” among traders.

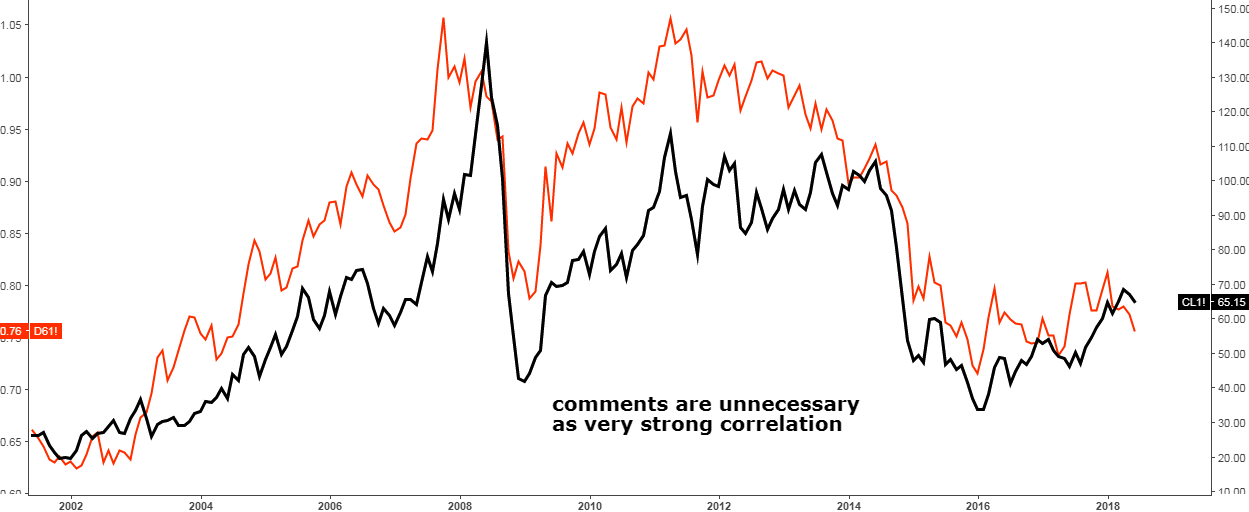
Before that, I built a chart to demonstrate the correlation between WTI crude oil and the Canadian Dollar.

Chart 1. WTI futures Vs. Canadian dollar futures: Perfect Correlation

Canadian Dollar
Chart courtesy of tradingview.com

In the chart above the WTI futures graph is black on the right scale and the Canadian Dollar futures graph (in US$ per 1 CAD) is red on the left scale. I didn’t add any annotations on the chart as you can clearly see that the correlation is just perfect and the most important fact is that the crucial market phases like strong moves and consolidations coincide in time. The Canadian Dollar tends to overshoot WTI amid market strength, but it is quite moderate during market weakness. Continue reading "Does Oil Hold The Key To The Canadian Dollar"

Commodities: Sell In May And Go Away?

Aibek Burabayev - INO.com Contributor - Metals - Sell In May And Go Away


Last August I posted a chart analysis of one particular commodity market index as I spotted an interesting pattern. As time goes by, we can see how my outlook emerged and after almost a year the market reached another crucial milestone or better yet a decision point.

This index is called The Thomson Reuters/CoreCommodity CRB Index (CRB). It is the gauge of the commodities market, which is comprised of 19 commodities: Aluminum, Cocoa, Coffee, Copper, Corn, Cotton, Crude Oil, Gold, Heating Oil, Lean Hogs, Live Cattle, Natural Gas, Nickel, Orange Juice, Silver, Soybeans, Sugar, Unleaded Gas, and Wheat.

So, if you watch commodities market, then the two charts below could be of strong interest to you.

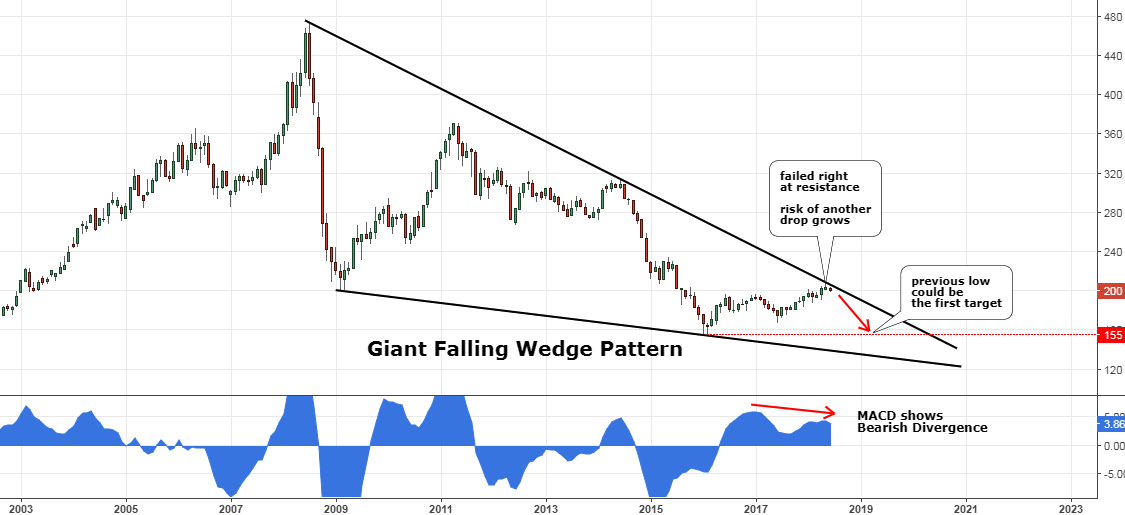
Chart 1. Thomson Reuters/Jefferies CRB Index Monthly: Failed At Resistance

Sell In May And Go Away
Chart courtesy of tradingview.com

Above is an update of the earlier chart. The risk/reward that time ($182) favored a long position as the upside target at the major top ($474) promised to cover risk extensively amid oversold market conditions. Continue reading "Commodities: Sell In May And Go Away?"

Crude Oil Could Crash Again

Aibek Burabayev - INO.com Contributor - Metals - Oil Could Crash Again


It is interesting how often exaggerated expectations prove to be wrong in the market. Crude oil is the dominant fossil fuel energy source, and therefore it draws a lot of attention as well as speculation.

Looking back, I remember a conversation with my boss earlier in the year who had talked to a large oil producing company and they said that it is highly improbable for crude oil to get over $55 per barrel amid the supply glut. WTI crude almost hit the $73 level this month to break similar pessimistic forecasts that had persisted in the market last year. OPEC’s deal together with Middle East tensions has driven the oil price to a 3-year high benefiting oil producing countries.

But these days I have started to hear different highly optimistic forecasts calling for $80-100 per barrel. When these voices began to grow into a full choir, I began to expect the thunder as this “sweet unison” is the leading contrarian indicator. Continue reading "Crude Oil Could Crash Again"

Silver Looks Into The Dark Abyss

Aibek Burabayev - INO.com Contributor - Metals - Silver


I hadn't updated the silver chart since February when I warned you that the metal dangerously approaches the support of the Triangle pattern. After that, I posted a gold update as I found an amazing historical similarity there.

There’s been so much water under the bridge since February, but nothing had changed in the precious metals markets until the end of last month when the crucial trigger was pulled.

Below is an updated chart of the silver that I would like to share with you these days as it contains an excellent trading opportunity.

Silver Weekly Chart: Triangle Was Broken Down

LLLL
Chart courtesy of tradingview.com

Silver could escape from that troubled situation which I pointed out in February as the price briefly punctured the downside of the Triangle pattern (orange) and then happily reversed higher on the back of broad dollar weakness. Continue reading "Silver Looks Into The Dark Abyss"