Does Oil Hold The Key To The Canadian Dollar

Aibek Burabayev - INO.com Contributor - Metals - Canadian Dollar


At the end of last month, I called for a substantial upcoming weakness in crude oil as the market could have finished the long-lasting consolidation after the earlier crash from 100+ levels. Indeed, oil lost almost $4 from that time and now is rebounding as markets naturally move in zigzags.

Oil-related currencies also suffer, and in this post, I would like to share with you an exciting chart setup with tremendous profit potential for one of such currency, the Canadian Dollar (CAD) also known as “Loonie” among traders.

Before that, I built a chart to demonstrate the correlation between WTI crude oil and the Canadian Dollar.

Chart 1. WTI futures Vs. Canadian dollar futures: Perfect Correlation

Canadian Dollar
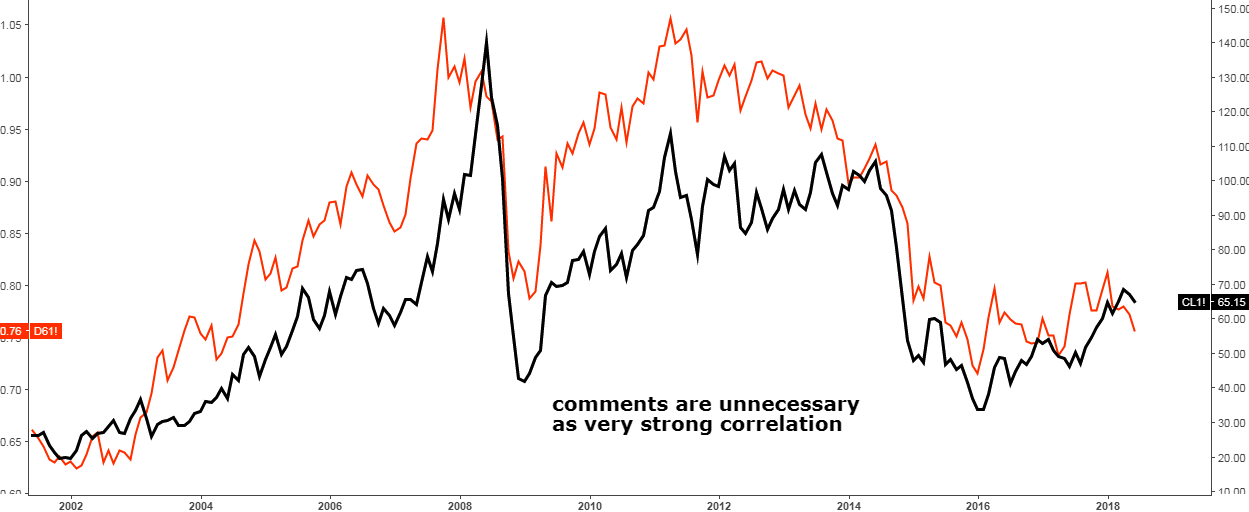
Chart courtesy of tradingview.com

In the chart above the WTI futures graph is black on the right scale and the Canadian Dollar futures graph (in US$ per 1 CAD) is red on the left scale. I didn’t add any annotations on the chart as you can clearly see that the correlation is just perfect and the most important fact is that the crucial market phases like strong moves and consolidations coincide in time. The Canadian Dollar tends to overshoot WTI amid market strength, but it is quite moderate during market weakness. Continue reading "Does Oil Hold The Key To The Canadian Dollar"

Crude Oil Could Crash Again

Aibek Burabayev - INO.com Contributor - Metals - Oil Could Crash Again


It is interesting how often exaggerated expectations prove to be wrong in the market. Crude oil is the dominant fossil fuel energy source, and therefore it draws a lot of attention as well as speculation.

Looking back, I remember a conversation with my boss earlier in the year who had talked to a large oil producing company and they said that it is highly improbable for crude oil to get over $55 per barrel amid the supply glut. WTI crude almost hit the $73 level this month to break similar pessimistic forecasts that had persisted in the market last year. OPEC’s deal together with Middle East tensions has driven the oil price to a 3-year high benefiting oil producing countries.

But these days I have started to hear different highly optimistic forecasts calling for $80-100 per barrel. When these voices began to grow into a full choir, I began to expect the thunder as this “sweet unison” is the leading contrarian indicator. Continue reading "Crude Oil Could Crash Again"

What Oil Price Band Do The Saudis Want?

Robert Boslego - INO.com Contributor - Energies


Back in December, I deduced that the Saudis had budgeted a little less than $53 for oil in 2017. Their budget was based on their belief that they didn't expect to see any U.S. shale oil production response in 2017. Saudi Energy Minister Khalid A. Al-Falih said it in answer to a question in the press conference after the OPEC/non-OPEC meeting (see video starting at 51:35). He backed-up his belief basing it on the time lag of when oil prices had peaked in 2014 and when production peaked in 2015.

After the deals went into effect on January 1st, oil prices remained above $50 per barrel. According to the EIA’s weekly production data, U.S. crude production rose by 318,000 b/d between the last week of December and the week ending March 3rd, just before Al-Fahil’s speech in Houston during on March 7th.

U.S. Crude Production

He said he is optimistic about the global oil market in the weeks and months ahead, but "I caution that my optimism should not tip investors into 'irrational exuberance' or wishful thinking that OPEC or the Kingdom will underwrite the investments of others at our own expense." Continue reading "What Oil Price Band Do The Saudis Want?"

Oil: Is It 2014 All Over Again?

Lior Alkalay - INO.com Contributor


In the past two weeks, crude oil futures took a beating; WTI futures ended last week at $46.47 per barrel while futures for Brent crude, the global benchmark, closed at $49.47 per barrel. Both WTI and Brent contracts have now concluded a 15% and 16% fall from their respective peak prices, closing at their lowest point since the deal between OPEC oil producers and 13 non-OPEC oil producers was signed. And the outlook for oil is not encouraging as a broader analysis of both the fundamentals and technical at play reveal a worrisome pattern—a pattern of an oversupplied oil market, ready to nose dive, as it did in 2014.

At the heart of the matter, as in 2014, is the US shale oil industry. Only this time around the US shale industry is significantly more competitive. According to Ron Ness, president of the North Dakota Petroleum Council quoted by Reuters, “the cost of extracting oil at Dunn County, North Dakota, is as low as in Iran” and “the cost of producing a barrel of oil is at $15 and falling" That figure is truly nothing short of dramatic! True, the production cost at Eagle Ford and Permian Delaware facilities is higher than Dunn country. And yet this figure underpins a very important change. In the next oil slump, shale producers won't be under the same pressure to cut production. Meanwhile, oil production in America has risen to 9.29 million barrels a day and is expected to surge to 10 million barrels a day by 2018. All the while, crude oil inventories are stubbornly high. The latest data from the EIA shows crude oil inventories were at 527.8 million barrels, at the higher end of the 5-year range. In fact, as the EIA chart below shows, US crude oil inventories have been persistently above the 5-year range for some time, suggesting demand for crude in the United States is too weak to accommodate the rising supply from shale oil. Continue reading "Oil: Is It 2014 All Over Again?"